These case studies are built on a deep analysis of EPL squads from 2020 to 2024, using injury data, wage efficiency metrics, and advanced squad analytics.
We explored injury costs, wage per contribution, and squad value performance to uncover trends.
From this, we selected four contrasting teams:
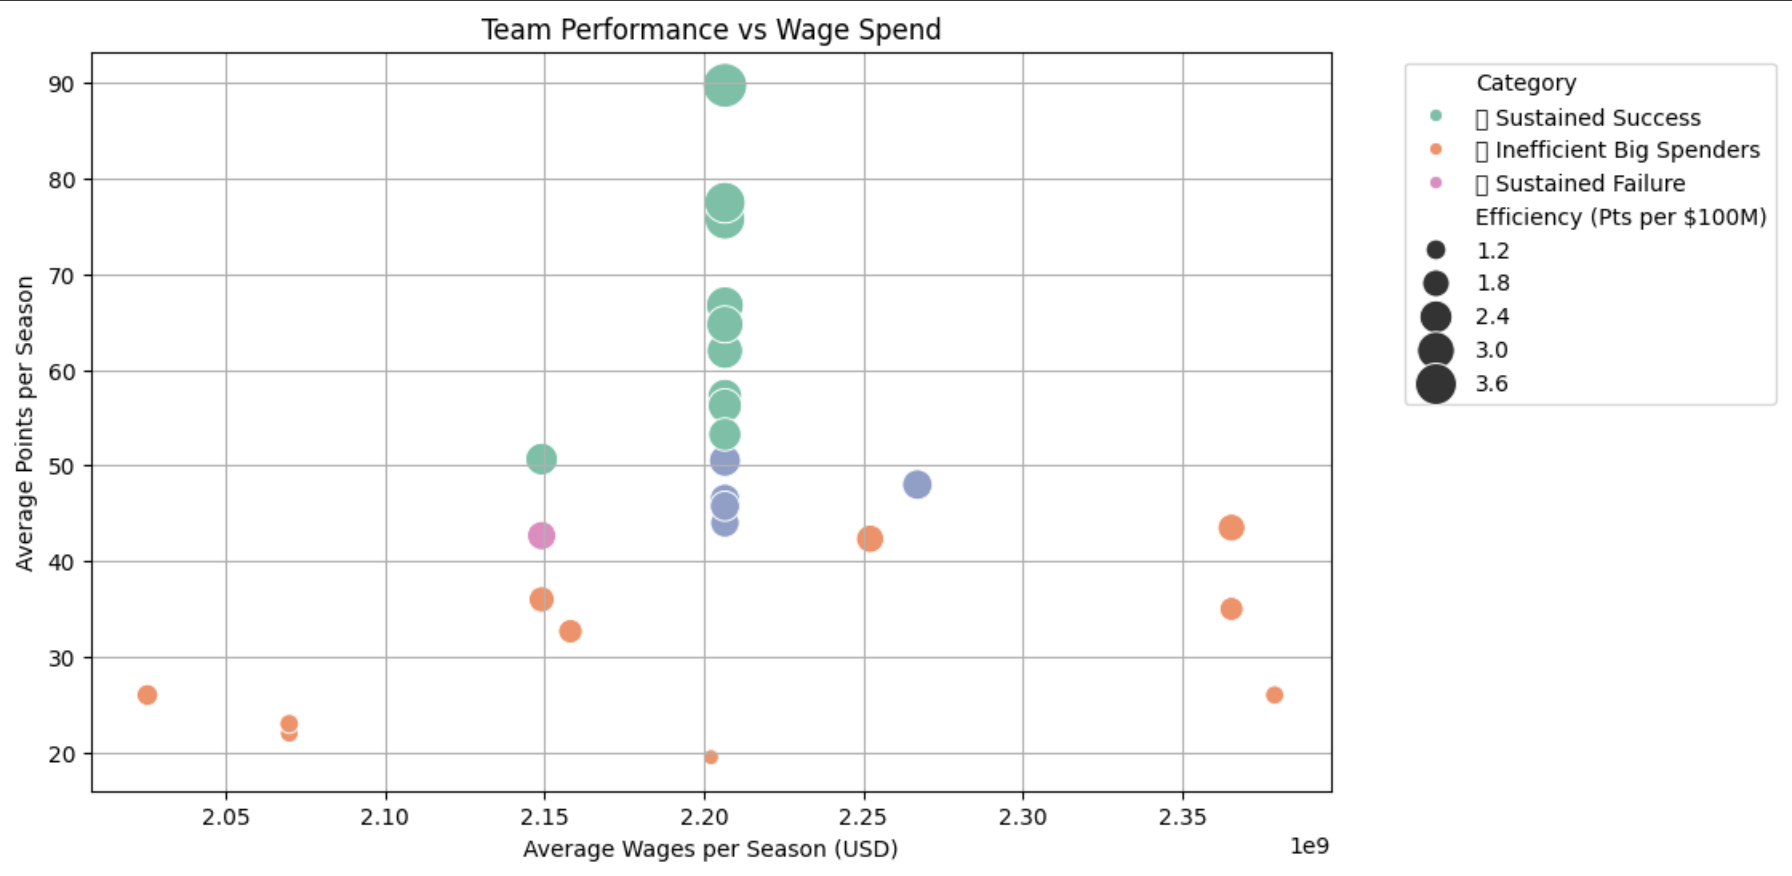
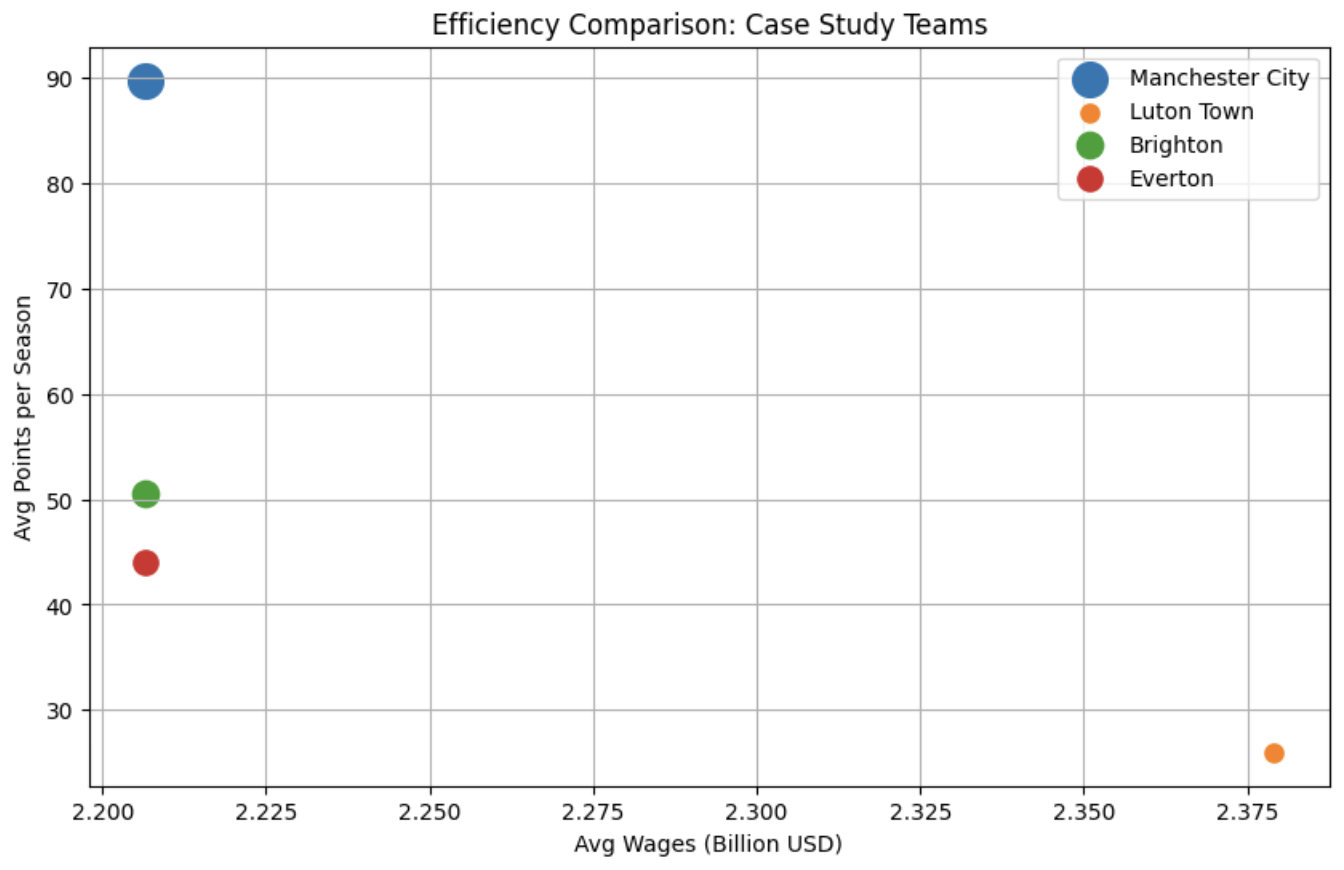
To identify clubs for deep analysis, we combined average league performance (points/season), injury cost, and financial efficiency metrics like WES, WPGC, and MVES.
We selected four teams that represent distinct case types: dominant efficient teams, budget overachievers, injury-affected underperformers, and smart spenders.
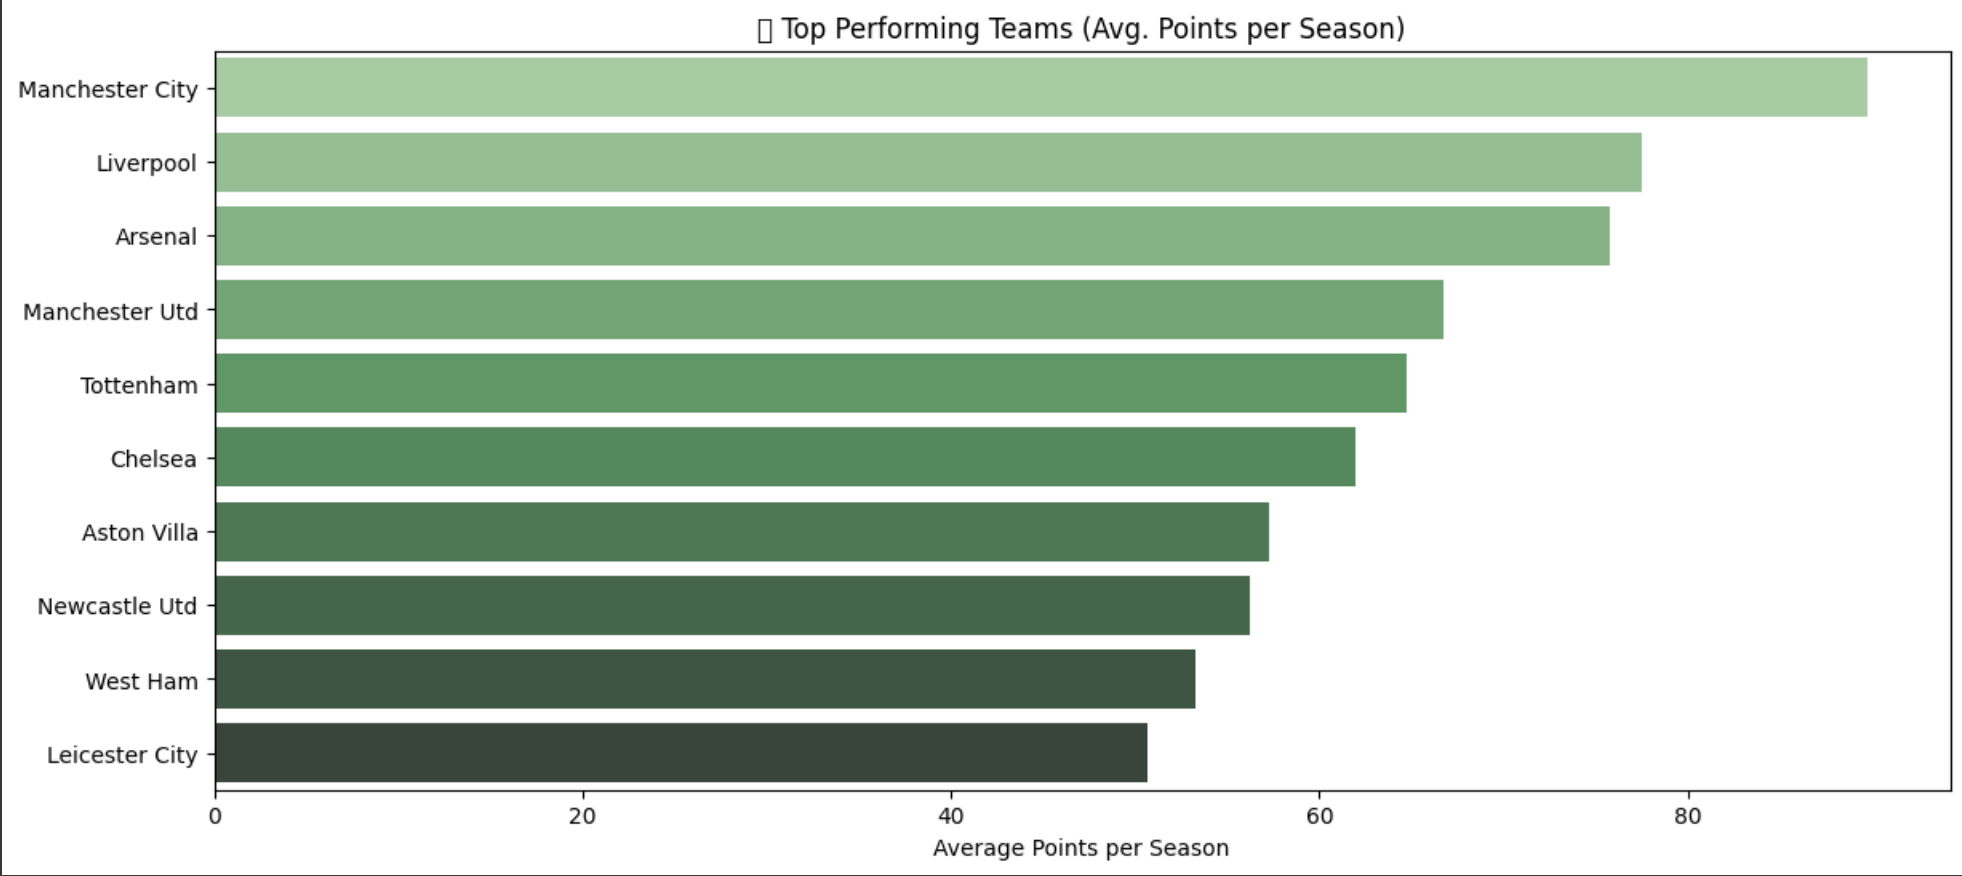
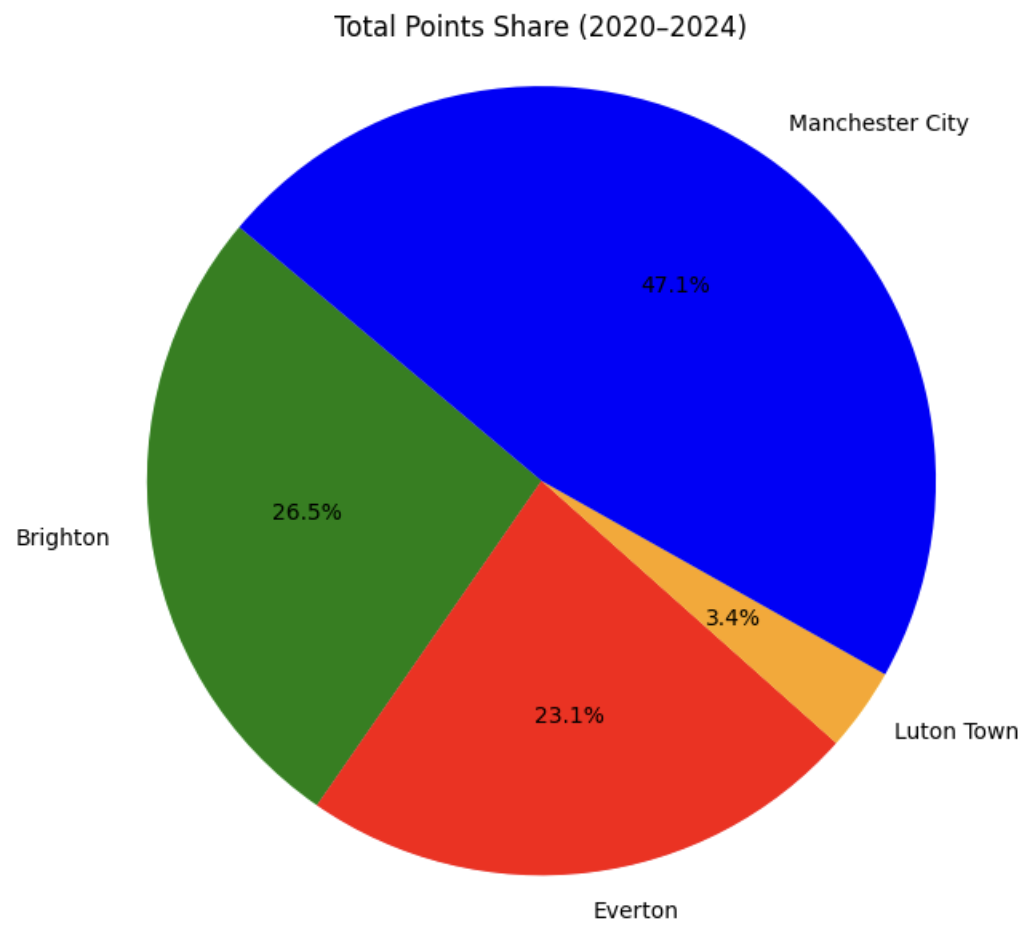
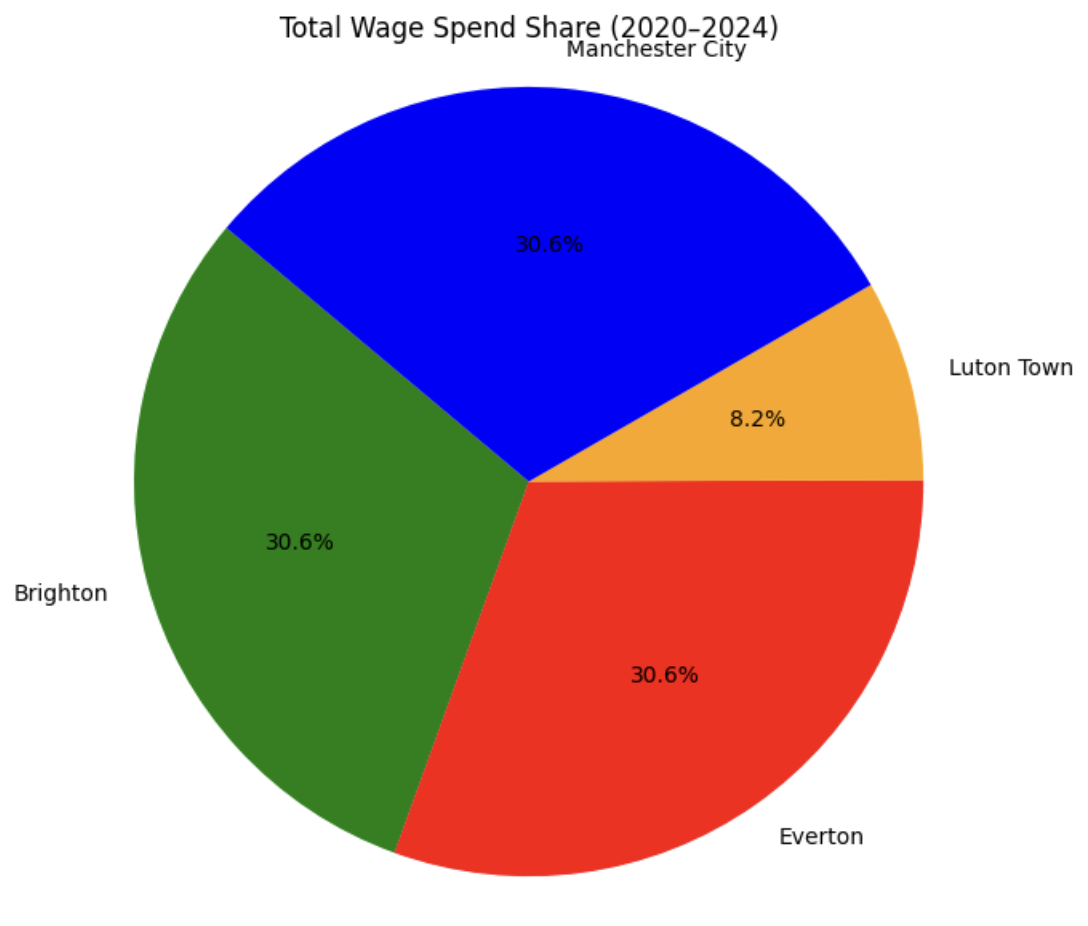
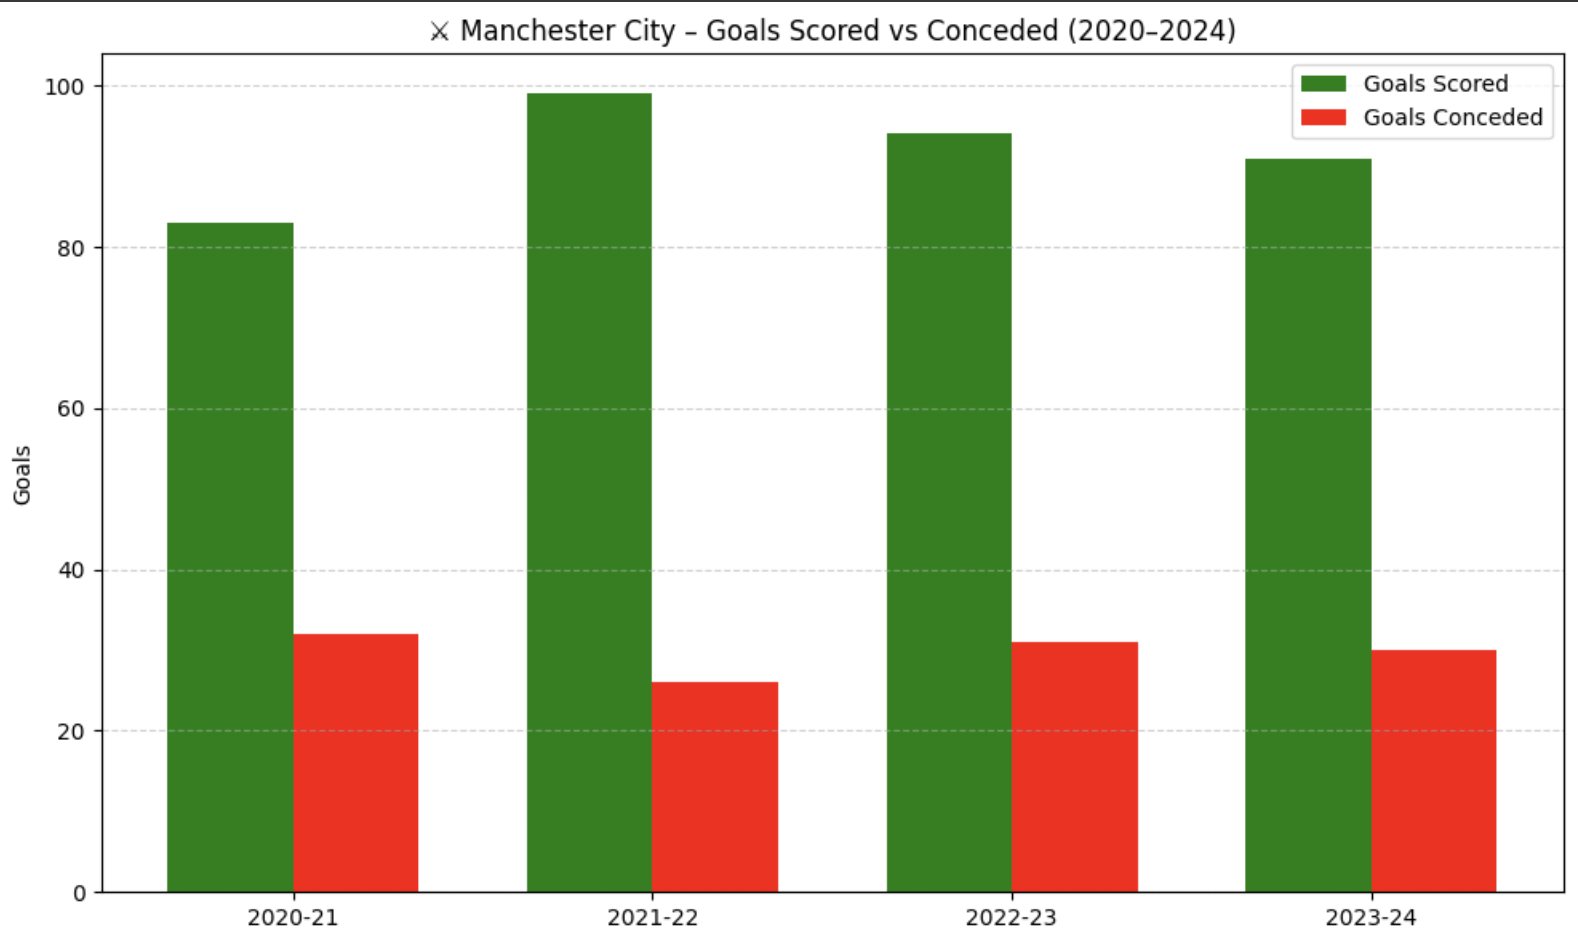
Teams like Manchester City, Liverpool, and Arsenal top the points table season after season. From our analysis, Manchester City stood out not just for performance but for low injury-related wage loss and strong Wage Efficiency Score (WES) — making them a perfect candidate to study sustained efficiency and squad depth.
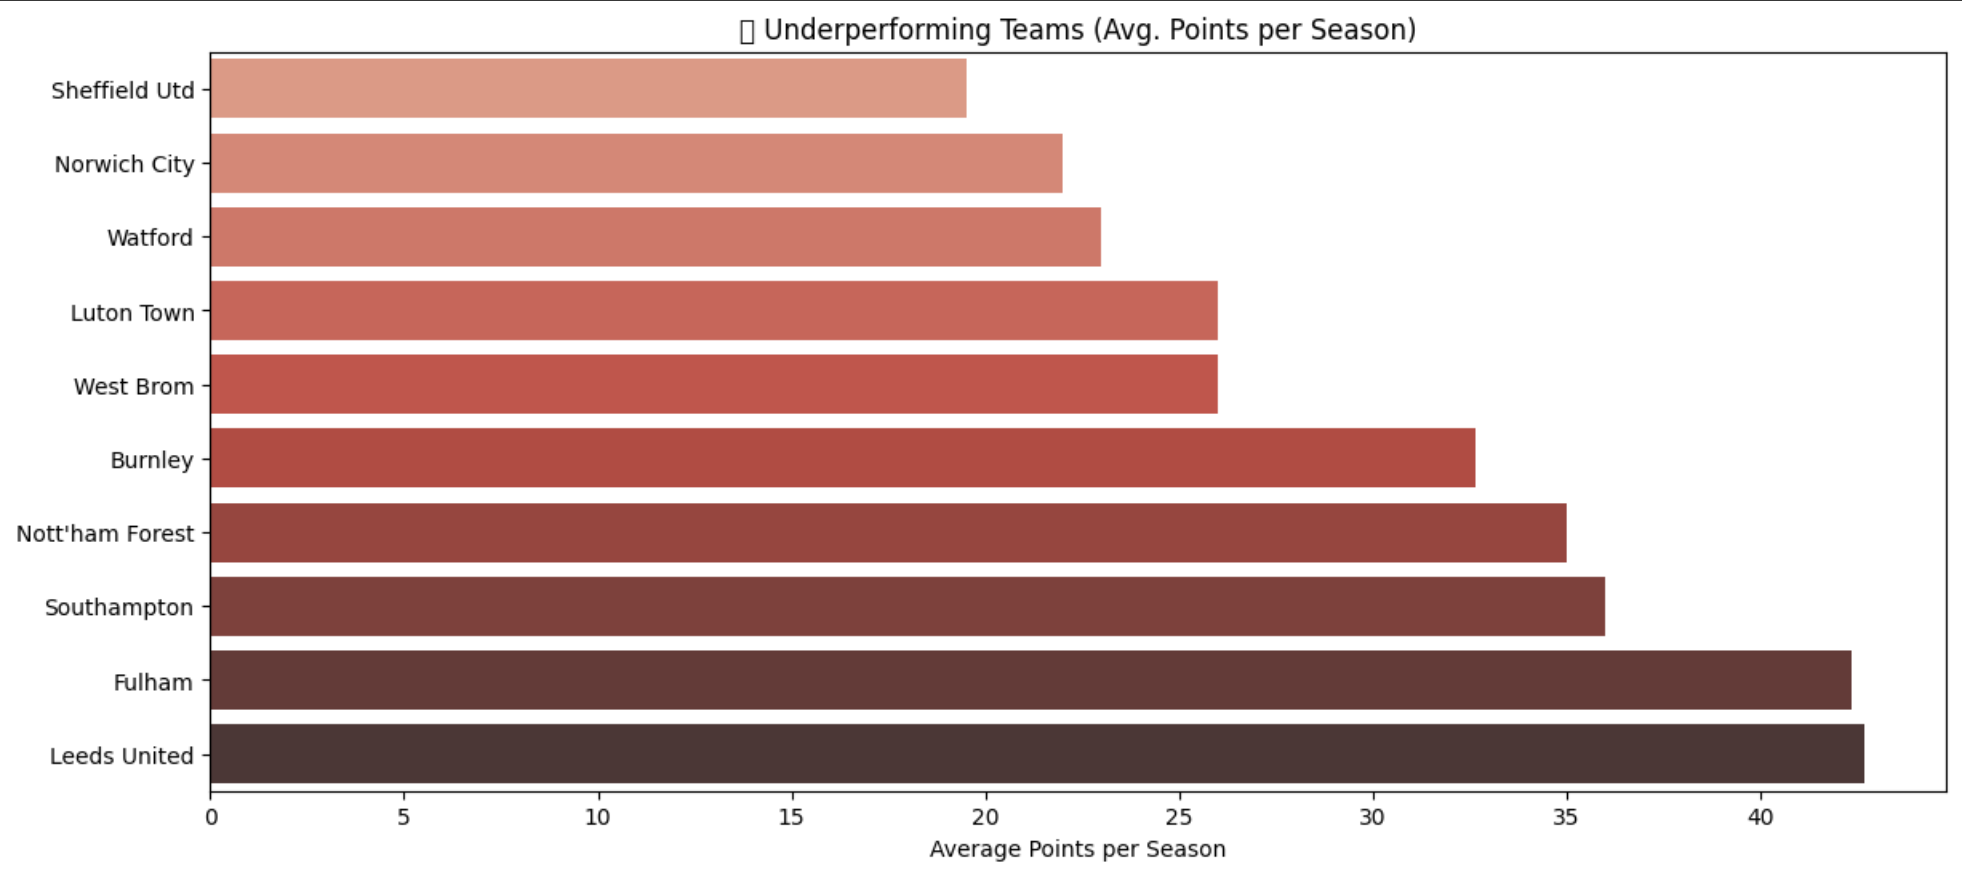
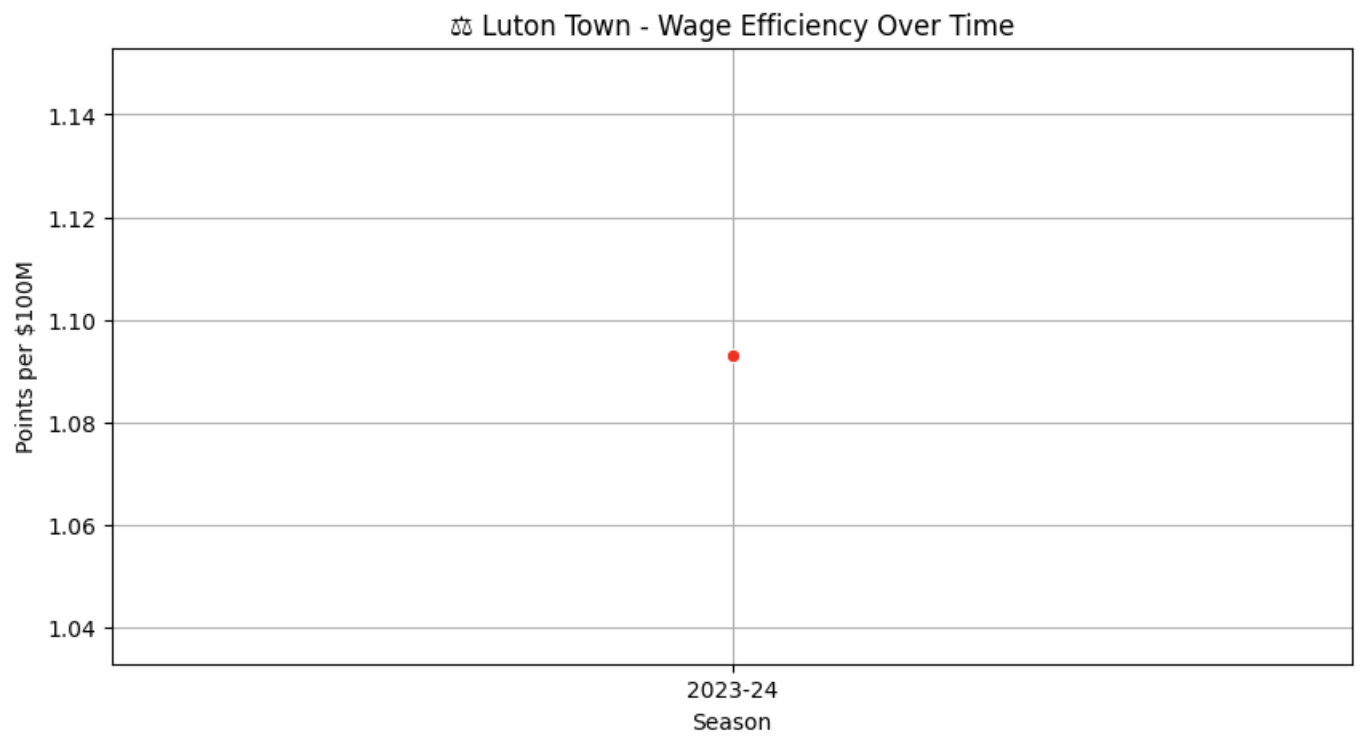
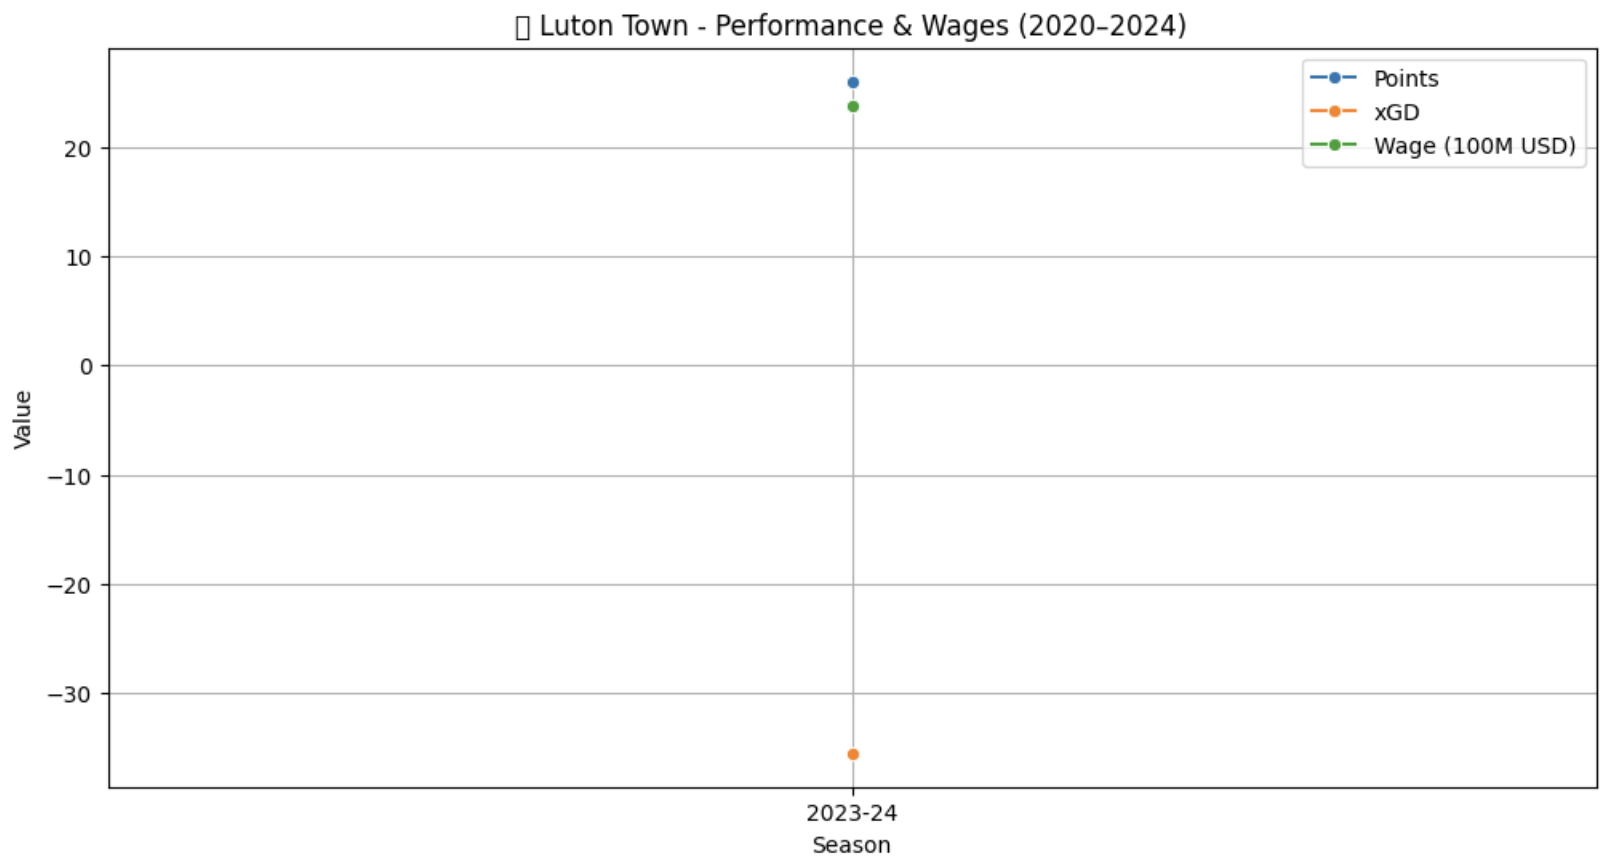
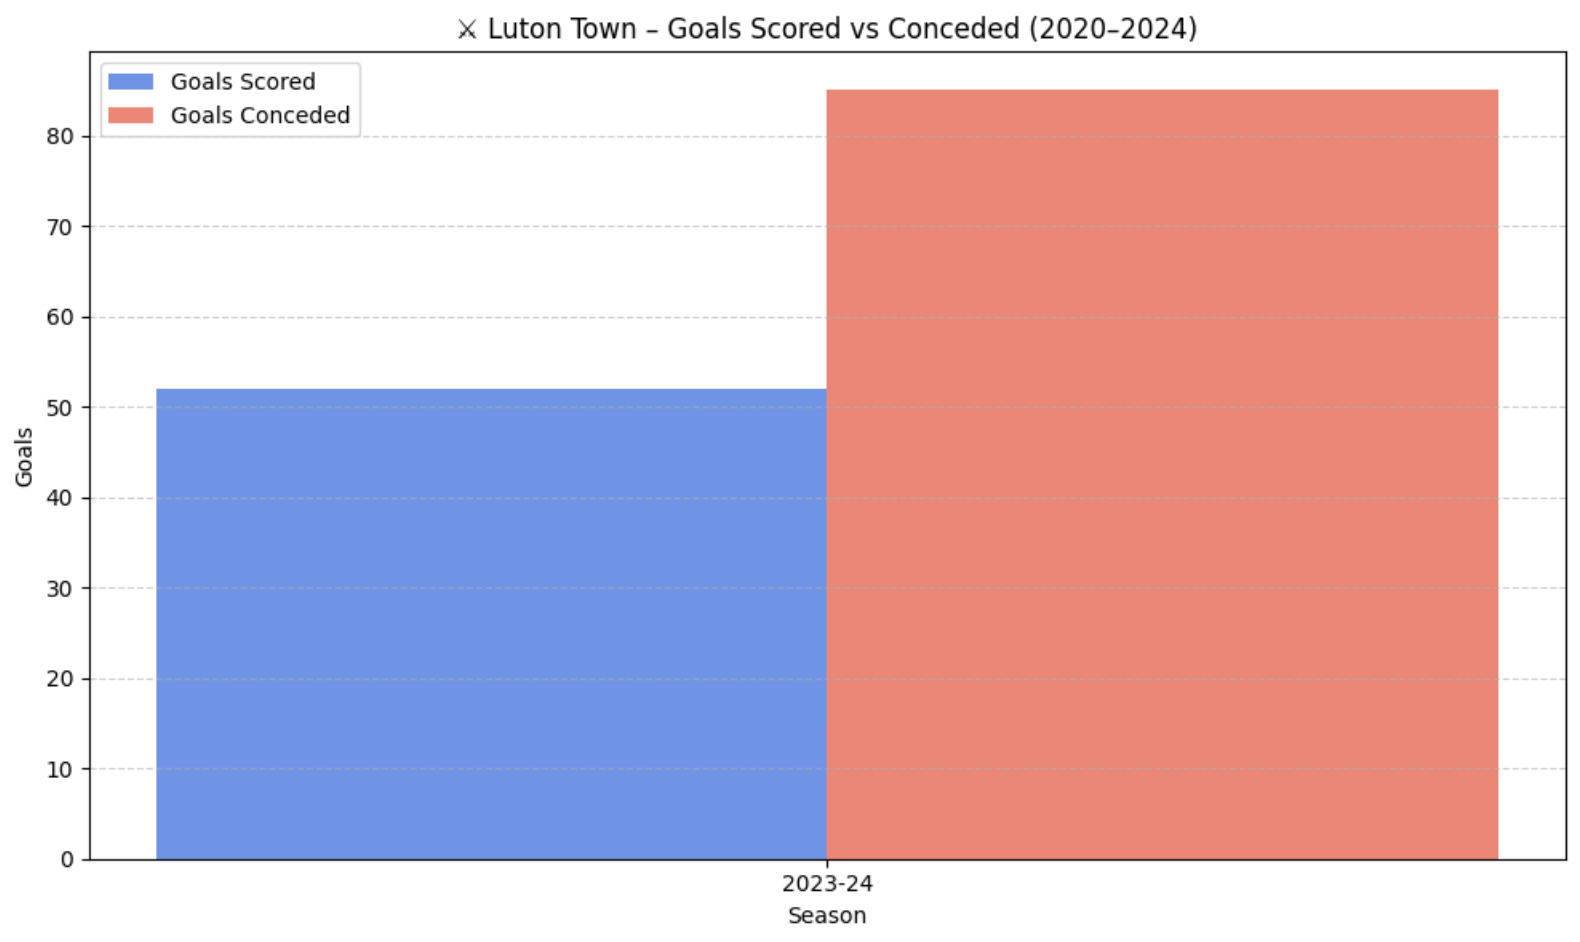
On the other end, clubs like Luton Town, Sheffield United, and Norwich show lower point averages. However, Luton Town surfaced as a fascinating case — despite being among the lowest earners, their cost-per-contribution ratios and squad value alignment were exceptional. A perfect example of overperformance on a tight budget.
This bubble chart shows how efficiently EPL teams converted wages into points over four seasons. The X-axis tracks wage spending, Y-axis shows points per season, and bubble size reflects efficiency. Manchester City shows dominance with high spend and output, Brighton proves smart spending, while Everton and Luton illustrate different types of inefficiency.
This pie chart breaks down total points earned from 2020–2024 by the four selected teams. Manchester City earned nearly half of the total, showcasing consistency. Brighton and Everton split a large chunk, while Luton’s contribution reflects its new entry and budget limitations.
Here, the wage spend share highlights how spending compares among the four teams. Despite spending similar amounts, Brighton delivered more points than Everton. Luton Town, with the lowest spend, demonstrates notable value.
This chart highlights how each club balances wage input and point output. Manchester City leads in output with acceptable efficiency, Brighton is most efficient per dollar, while Everton spent more with weaker output. Luton appears as a budget struggler with output not scaling to even limited investment.
A comparison of average xGD vs actual points. Teams above the dotted line overperformed their expected goal difference. Brighton and City sit closest to the line, while Everton and Luton underperform despite tactical structure or expected returns.
Manchester City’s rise from a historic club with a loyal following to a modern-day footballing juggernaut has been nothing short of extraordinary. Under the leadership of Pep Guardiola since 2016, City has not only won titles — they've redefined how success is built: with tactical fluidity, data-driven squad management, and meticulous financial oversight.
From 2020 to 2024, the squad evolved from the Kevin De Bruyne–Sergio Agüero axis to a versatile, dynamic engine built around stars like Erling Haaland, Phil Foden, Rodri, and João Cancelo. Each season reflected a balance of identity and adaptability.
City mastered the art of converting wage investment into tactical and statistical dominance — with minimal injury disruptions, ruthless squad depth, and consistent elite output.
Manchester City’s golden balance was achieved in 2021–22, reaching 4.49 points per $100M invested — the highest in this span.
Even as wage spending fluctuated, they maintained elite efficiency. A minor dip in 2022–23 aligned with reinvestment phases, but the club consistently turned financial muscle into on-field dominance.
Points, expected goal difference (xGD), and wage spend trends tell a story of performance consistency despite year-to-year wage variations. City’s peak xGD mirrored their high-scoring, low-conceding identity.
Even when wage hikes didn’t yield proportionate xGD jumps, the team stayed tactically superior — thanks to system reliability and deep squad utilization.
The 2021–22 season delivered a remarkable +73 goal difference — 99 goals scored, just 26 conceded — City’s most dominant two-way season.
Across all four seasons, they consistently outscored opponents while controlling transitions and minimizing goals conceded — proving that efficiency isn’t just about wages, but about tactical clarity and match control.
Brighton & Hove Albion’s trajectory from a mid-table battler to a club recognized for tactical bravery and financial finesse is one of the Premier League’s most admired transformations.
From 2020 to 2024, Brighton showcased how smart recruitment, youth development, and strategic risk-taking can deliver results even without a top-6 budget. Their evolving attacking style, combined with low-cost acquisitions like Moisés Caicedo and Alexis Mac Allister, redefined the club’s playing identity.
Brighton emerged not just as a surprise package but as an efficient machine — achieving high performance relative to wage spend and player market value. Their data-led philosophy underpinned their growth into one of the EPL’s smartest modern outfits.
Brighton’s wage efficiency steadily increased from 2020–21 to 2022–23, peaking at 2.65 points per $100M — a benchmark most top teams fail to hit even with higher budgets.
Despite a dip in 2023–24, their 4-year average remained elite, underscoring smart investments, high-performing low-cost players, and exceptional financial planning across seasons.
Brighton’s points tally steadily increased alongside a rise in expected goal difference (xGD), with both peaking in 2022–23. Notably, their wage spending remained consistent across all four seasons.
This strong output despite static financial input illustrates Brighton’s data-first strategy, exceptional scouting, and coaching cohesion. A team that delivers more with less.
In 2022–23, Brighton exploded offensively with 72 goals scored, the highest in their 4-year span. This attacking leap came with improved possession play and tactical confidence.
While their 2023–24 defense conceded more (62 goals), the evolution shows Brighton’s bold shift toward high-risk, high-reward football — proving you don’t need megastar payrolls to entertain or compete.
Once considered a steady mid-table force, Everton’s journey between 2020 and 2024 paints a different picture — one of inconsistent planning, high wage expenditure, and diminishing returns on investment.
Despite possessing one of the larger wage budgets outside the traditional “Big 6,” the club consistently underperformed across both offensive and defensive metrics. Managerial instability, recruitment misfires, and tactical uncertainty plagued their progress.
As we'll see through the following breakdowns, Everton’s struggles weren’t from a lack of spending — but from a lack of strategic cohesion and return on financial effort.
Everton’s efficiency in converting wages to points dropped sharply from 2.91 points per $100M in 2020–21 to a low of 1.53 in 2022–23.
Although there was a minor recovery in 2023–24, the long-term trend shows ineffective wage deployment and poor ROI — especially compared to leaner but more efficient clubs like Brighton.
Points and expected goal difference (xGD) plummeted post-2020–21 while wage spending remained constant — a red flag in strategic allocation.
2022–23 marked their worst season in terms of xGD (–20) and near-relegation performance. The disconnect between investment and outcome highlights structural flaws across recruitment, injury management, and coaching tactics.
Everton’s goal output fell drastically in 2022–23 — only 34 goals scored — while conceding a hefty 57+ goals in back-to-back seasons.
A leaky defense combined with an inefficient frontline exposed deeper tactical concerns. The 2023–24 season saw marginal improvement, but overall, this was a club battling decline — not challenging for Europe.
Luton Town’s remarkable journey to the Premier League spotlight is a story of grit, tactical tenacity, and overperformance on a limited budget.
With one of the lowest wage bills in the league, Luton's approach in the 2023–24 season emphasized structure, pressing intensity, and collective effort over star power. Though their results show struggle against top-tier opposition, the efficiency and unity within the squad paints a different picture beneath the surface.
Despite limited resources, Luton showcased how passion and planning can keep a club competitive — even when odds seem stacked against them.
In their only EPL season (2023–24), Luton earned 1.09 points per $100M — impressive given their low wage outlay. While this metric may trail elite clubs, it underlines how Luton optimized performance per dollar spent.
With minimal big-name players, their squad’s work rate and cohesion allowed them to stay within touching distance of several mid-table teams.
The 2023–24 graph reveals that while Luton accumulated 25 points, their xGD (expected goal difference) was around -35 — a clear signal of defensive strain and offensive inefficiency.
Yet, their wage curve remained nearly flat, emphasizing the fact that spending was kept low while maximizing output. A statistical profile of a team battling for survival — and often succeeding through sheer discipline and desire.
Luton managed to score 52 goals in the 2023–24 season — a figure that exceeds several teams with higher wage bills. However, their defense leaked 85 goals, the highest among the bottom half.
This imbalance reflects their tactical choice of playing front-foot football — admirable, but risky. While entertaining, the gap between attack and defense underscores the growing pains of adapting to Premier League intensity.