💥 English Premier League - Injury Report (2020–2024)

Examine the toll injuries have taken on key EPL clubs — from lost wages and missed matches to recovery trends and financial burden.

🩺 EPL Injury Impact: Risk, Cost & Value Loss

Explore the deeper financial and tactical implications of player injuries in the Premier League. From risk tiers to wage loss and market impact — here’s what the data reveals.
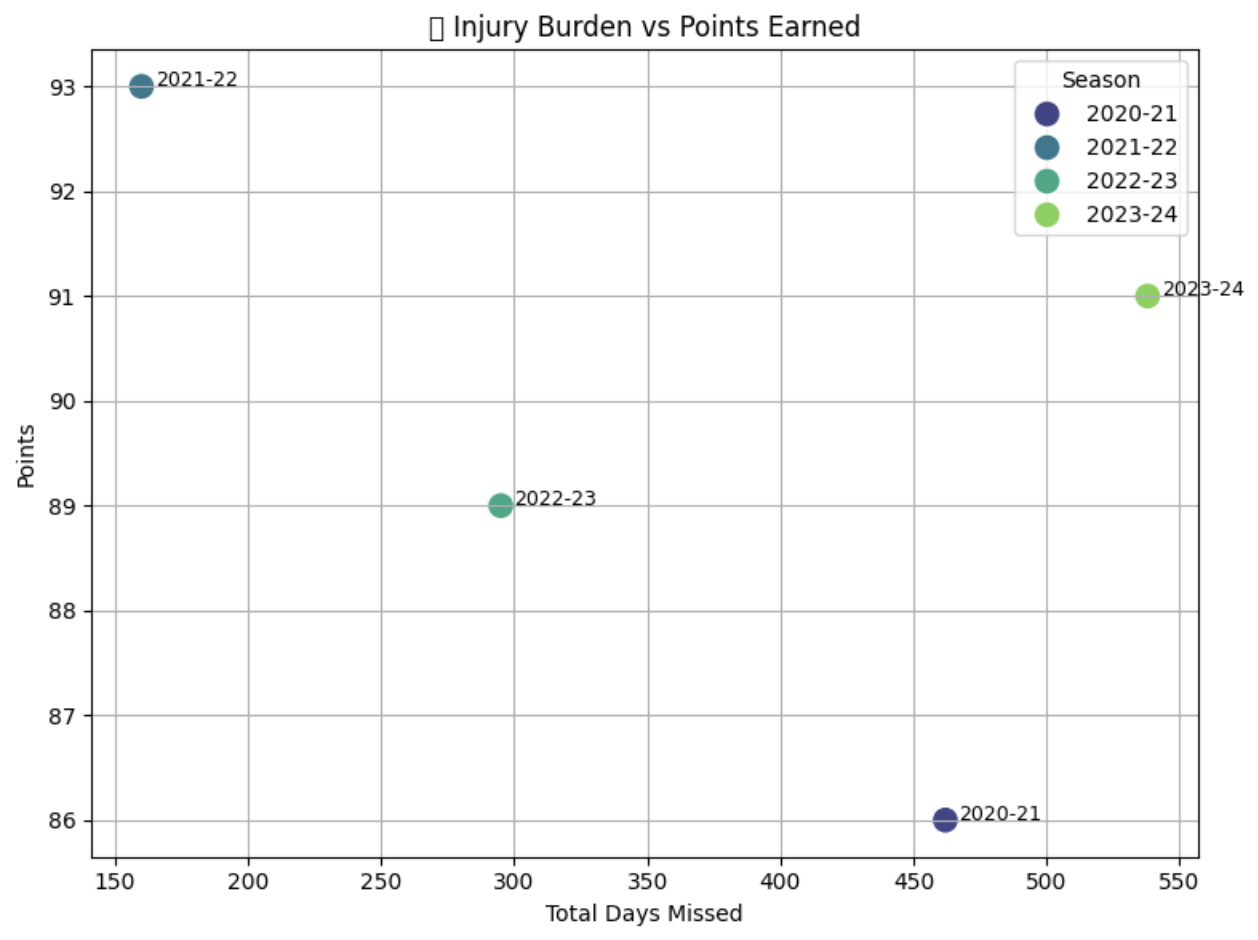
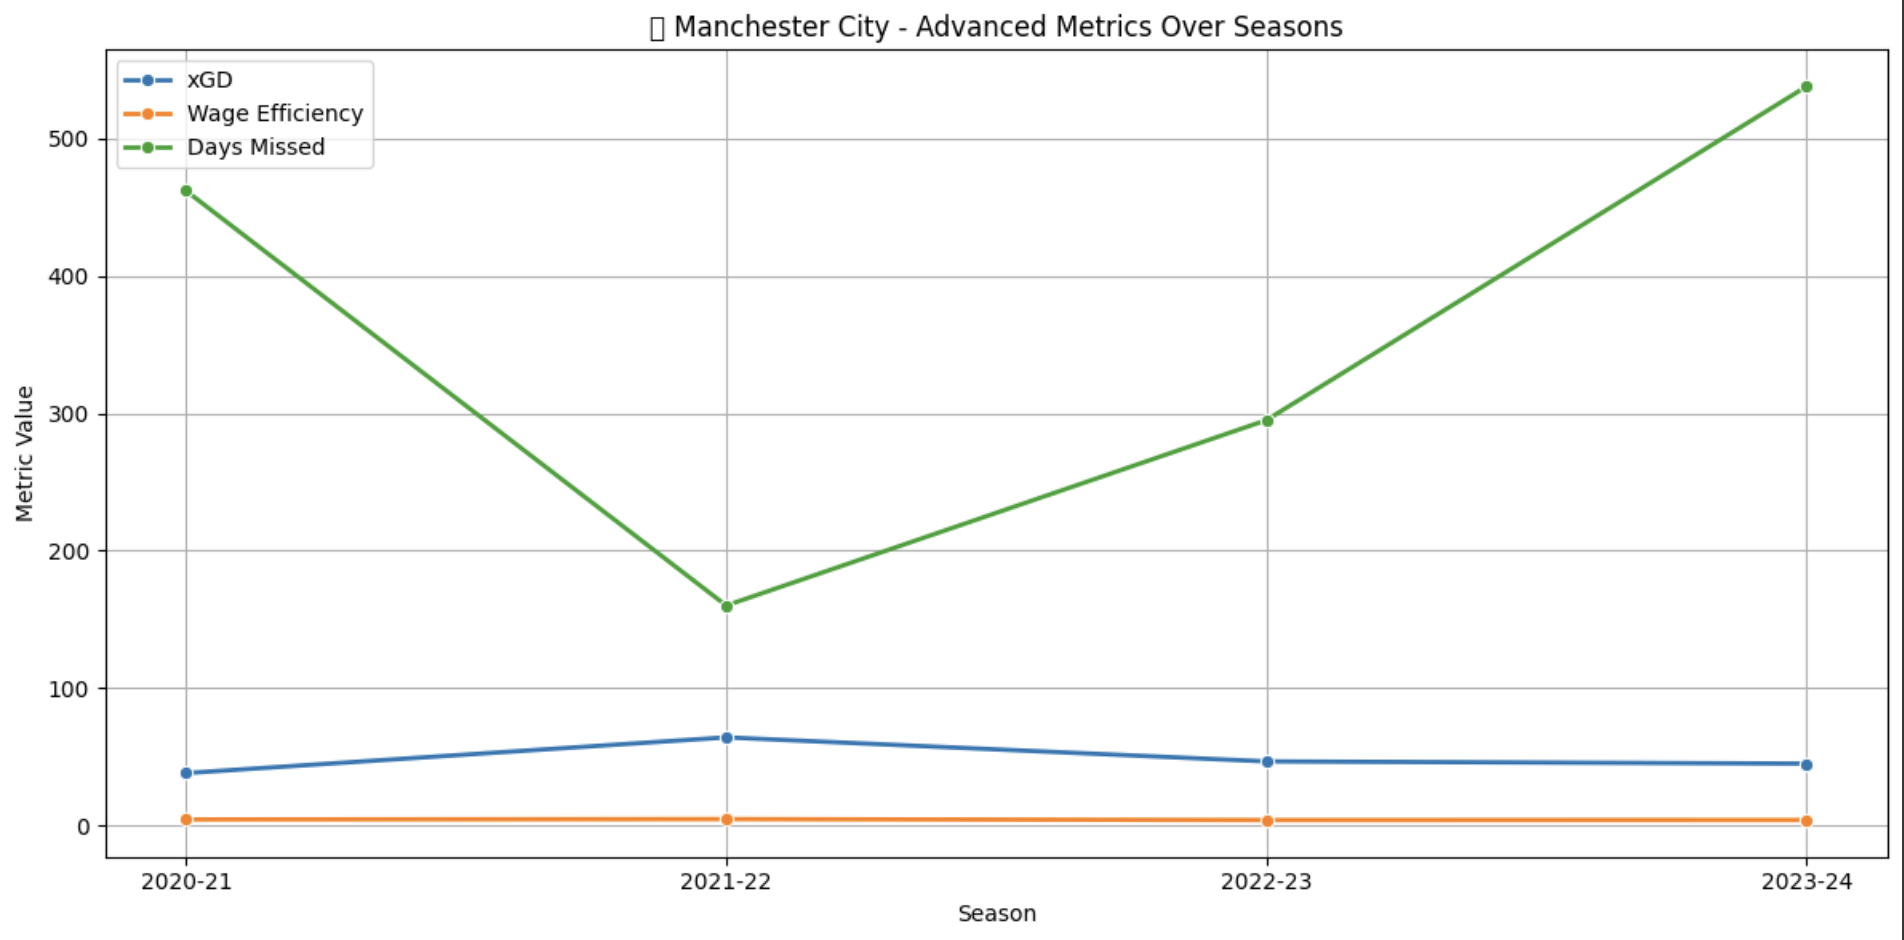
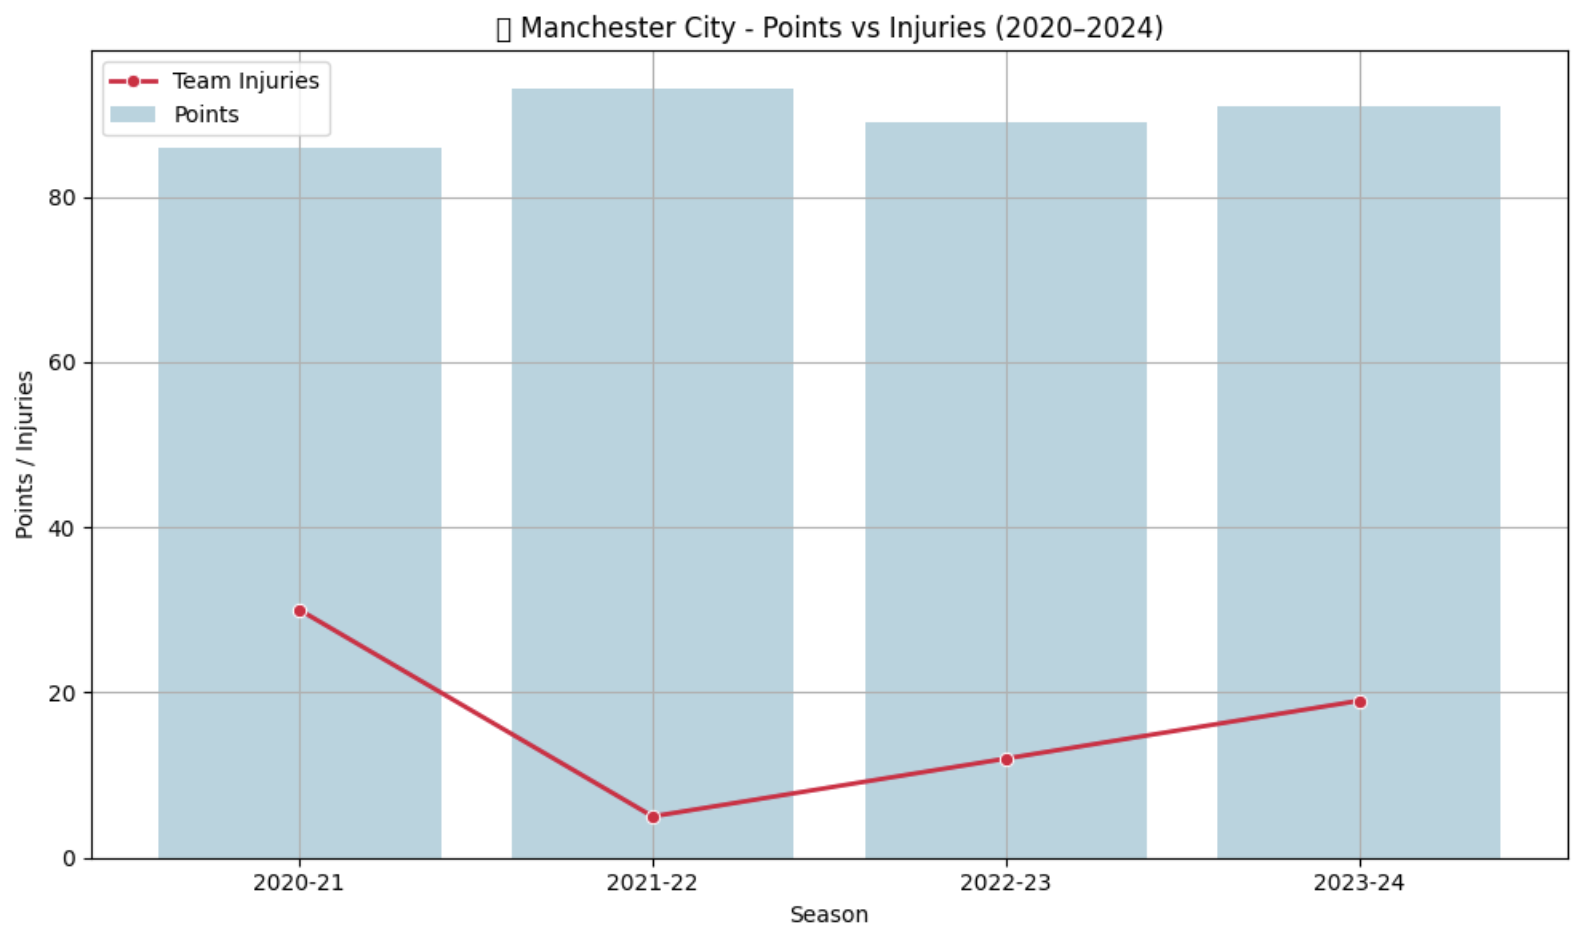
Manchester City

High performance despite injury disruptions. See how minimal wage loss kept their dominance intact.
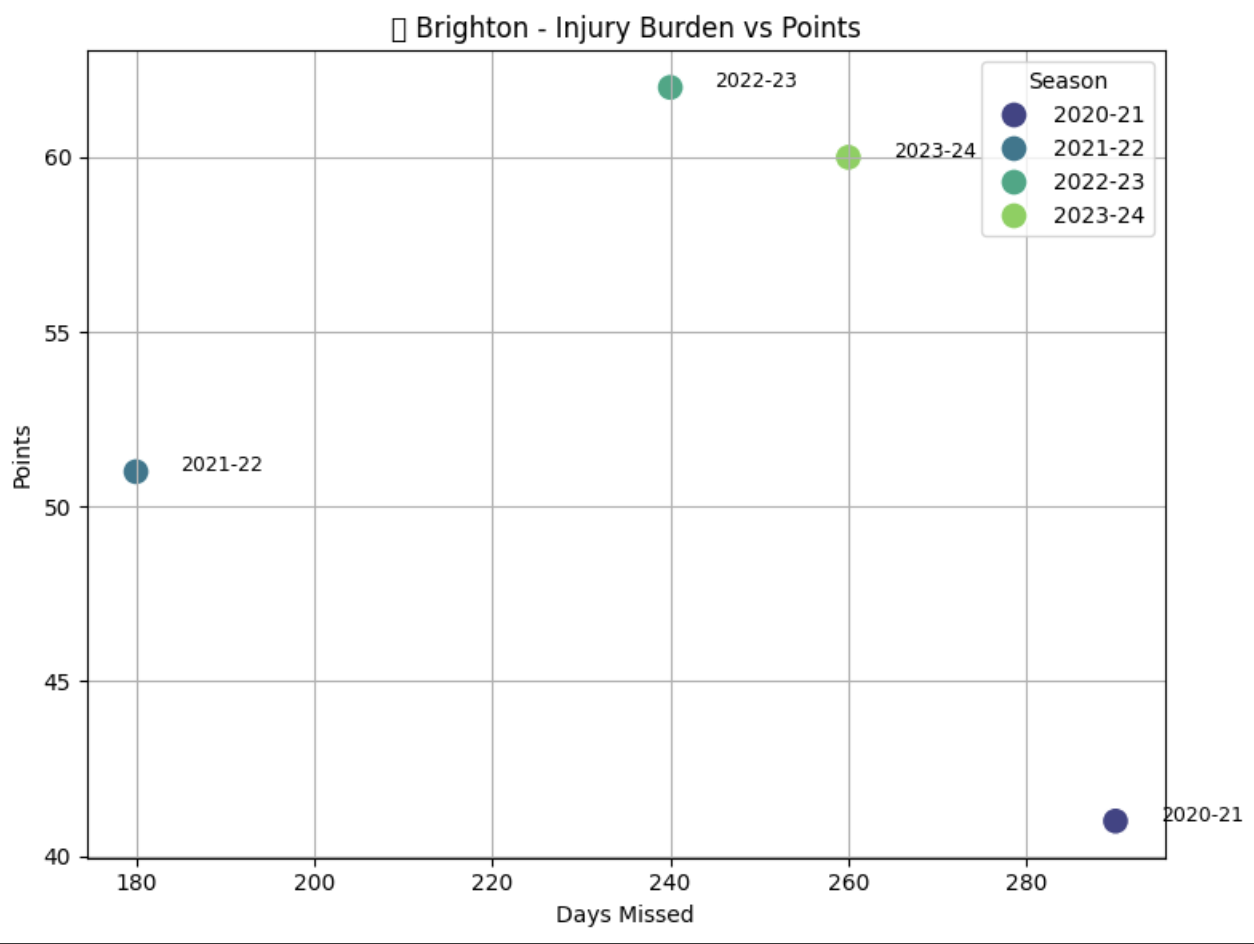
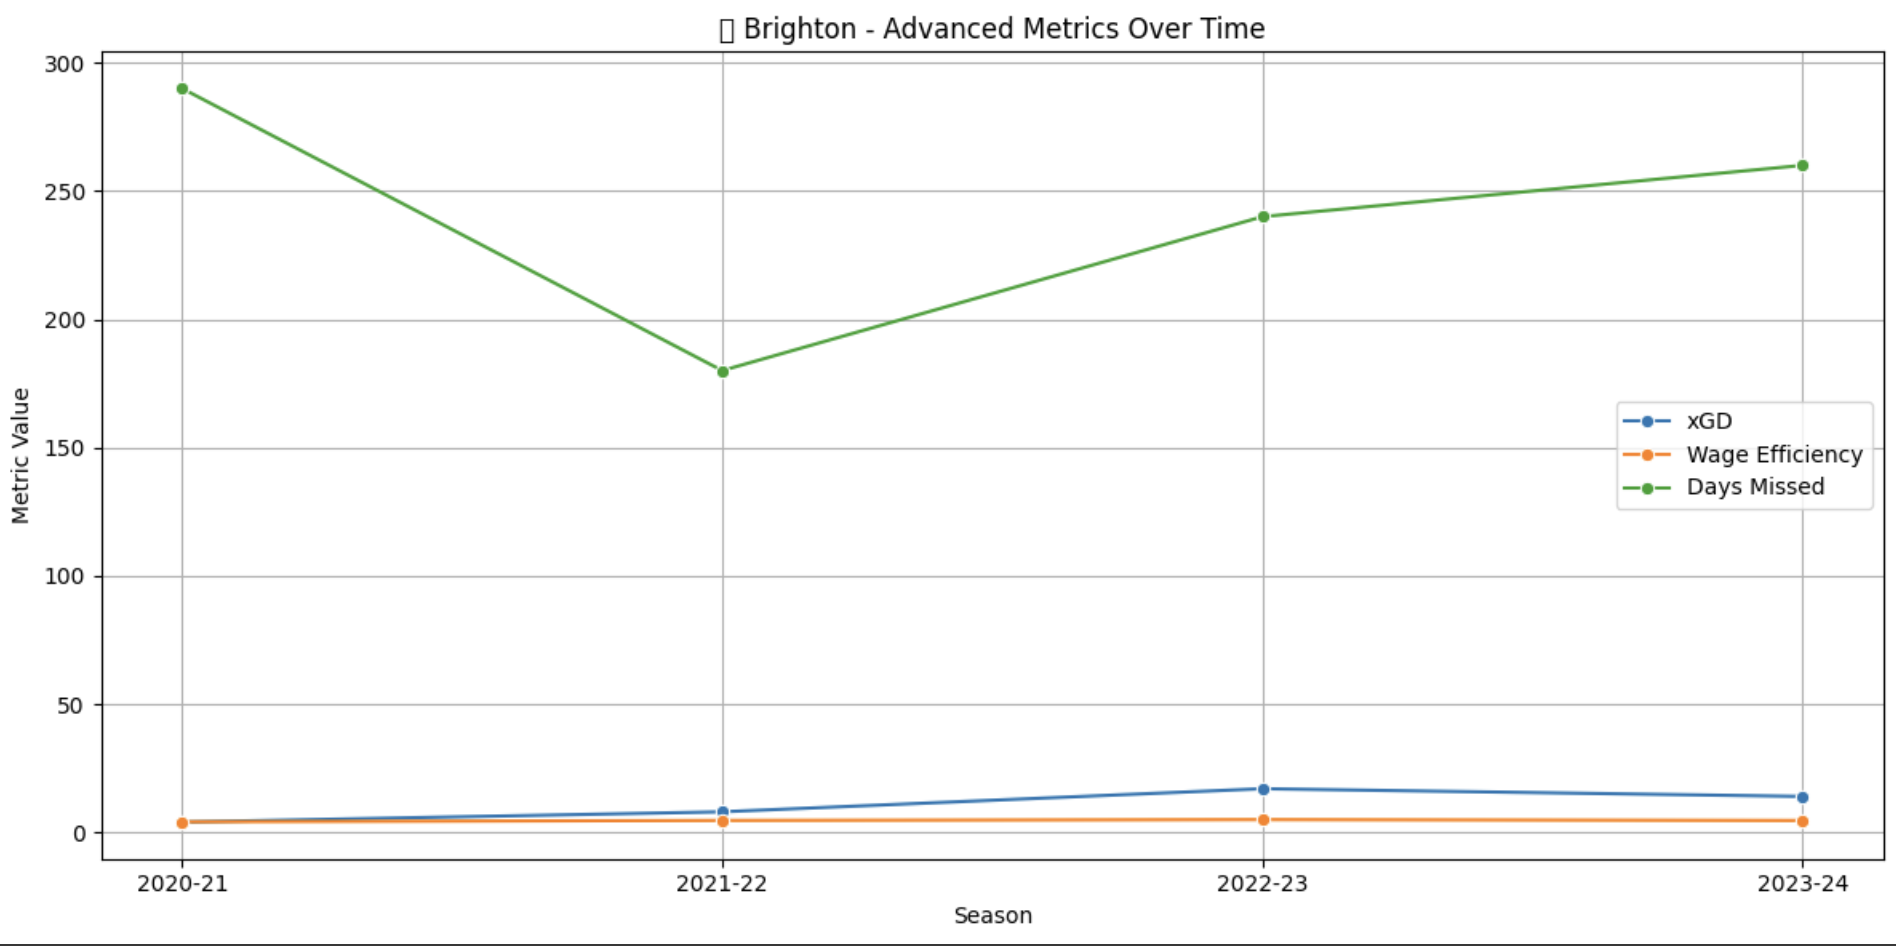
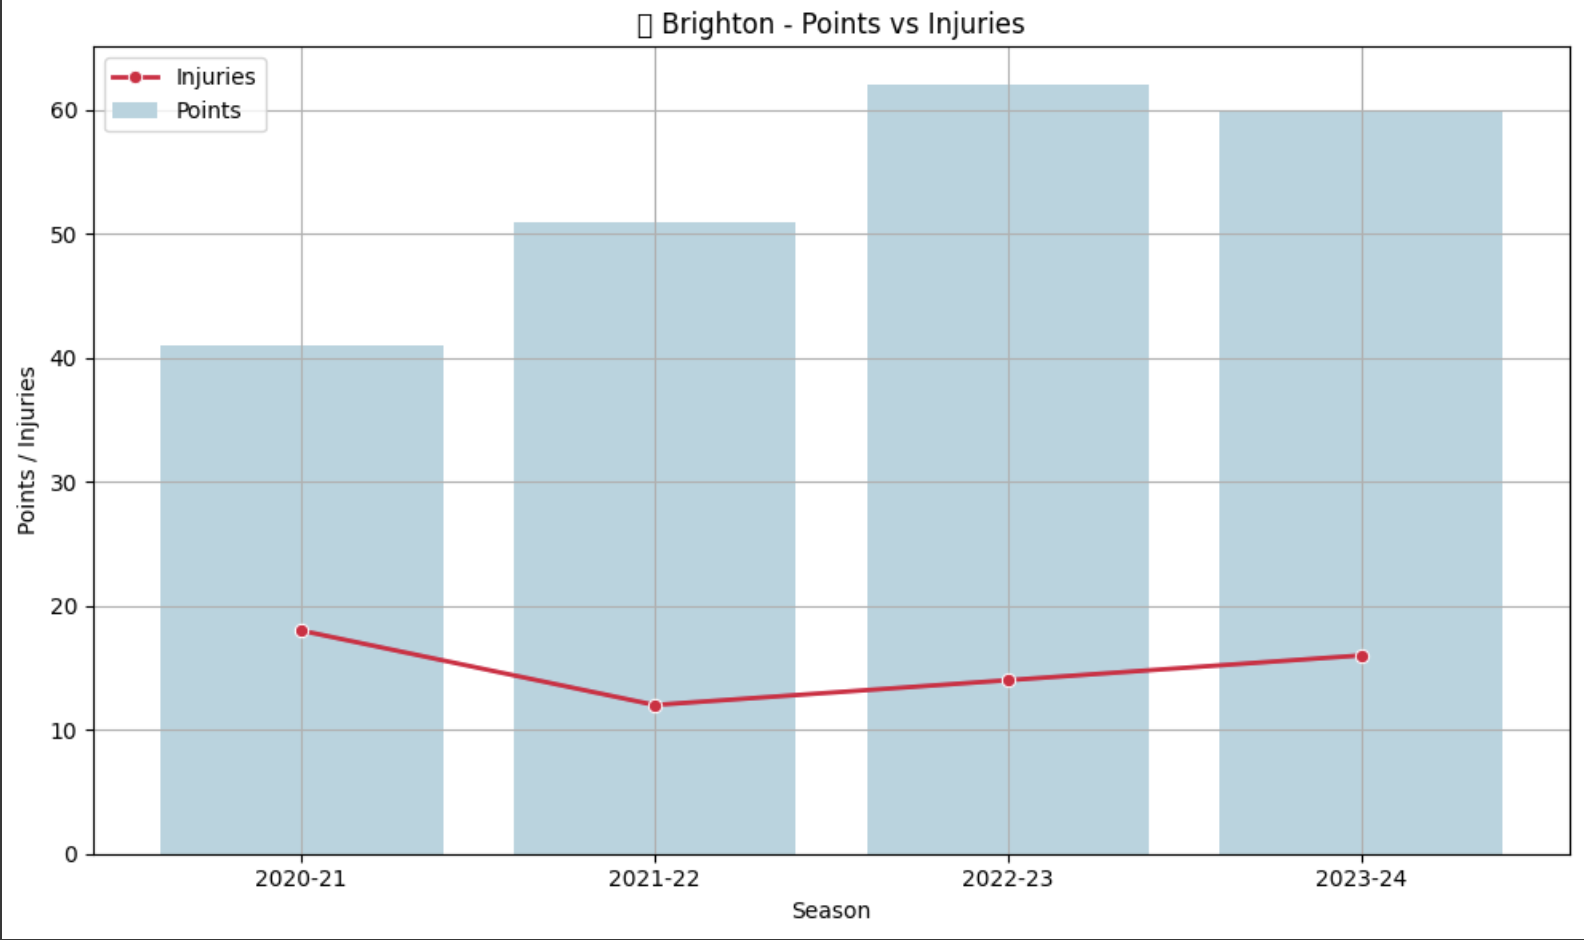
View Insights →

Brighton

Small injuries, big effect. Discover how Brighton managed risk and maximized value from their lean squad.
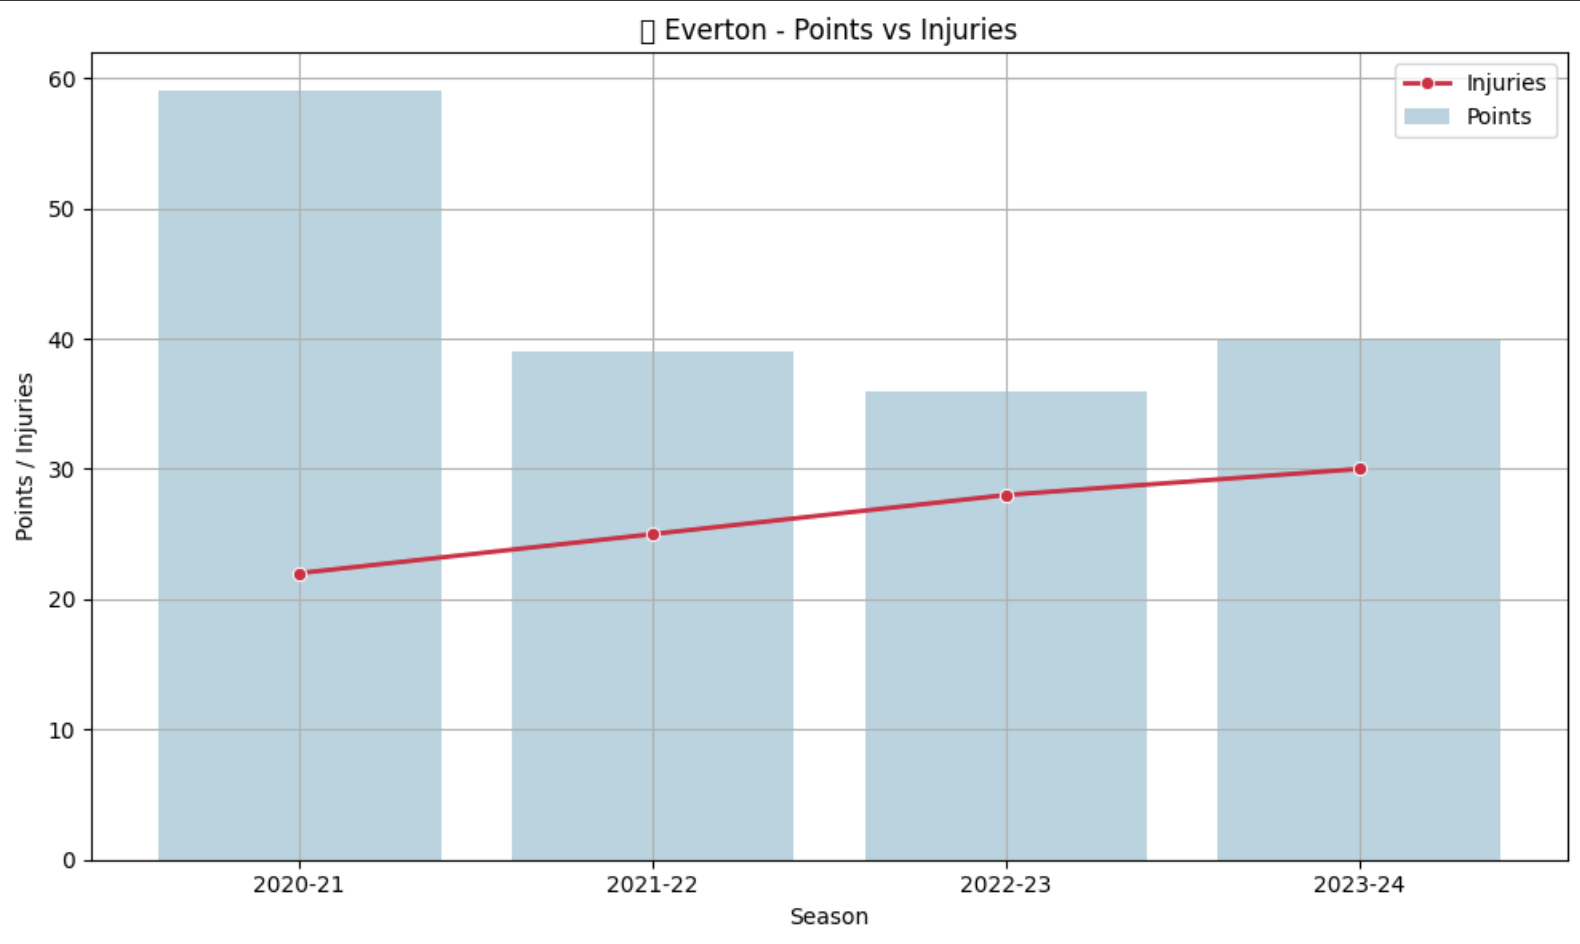
View Insights →

Everton

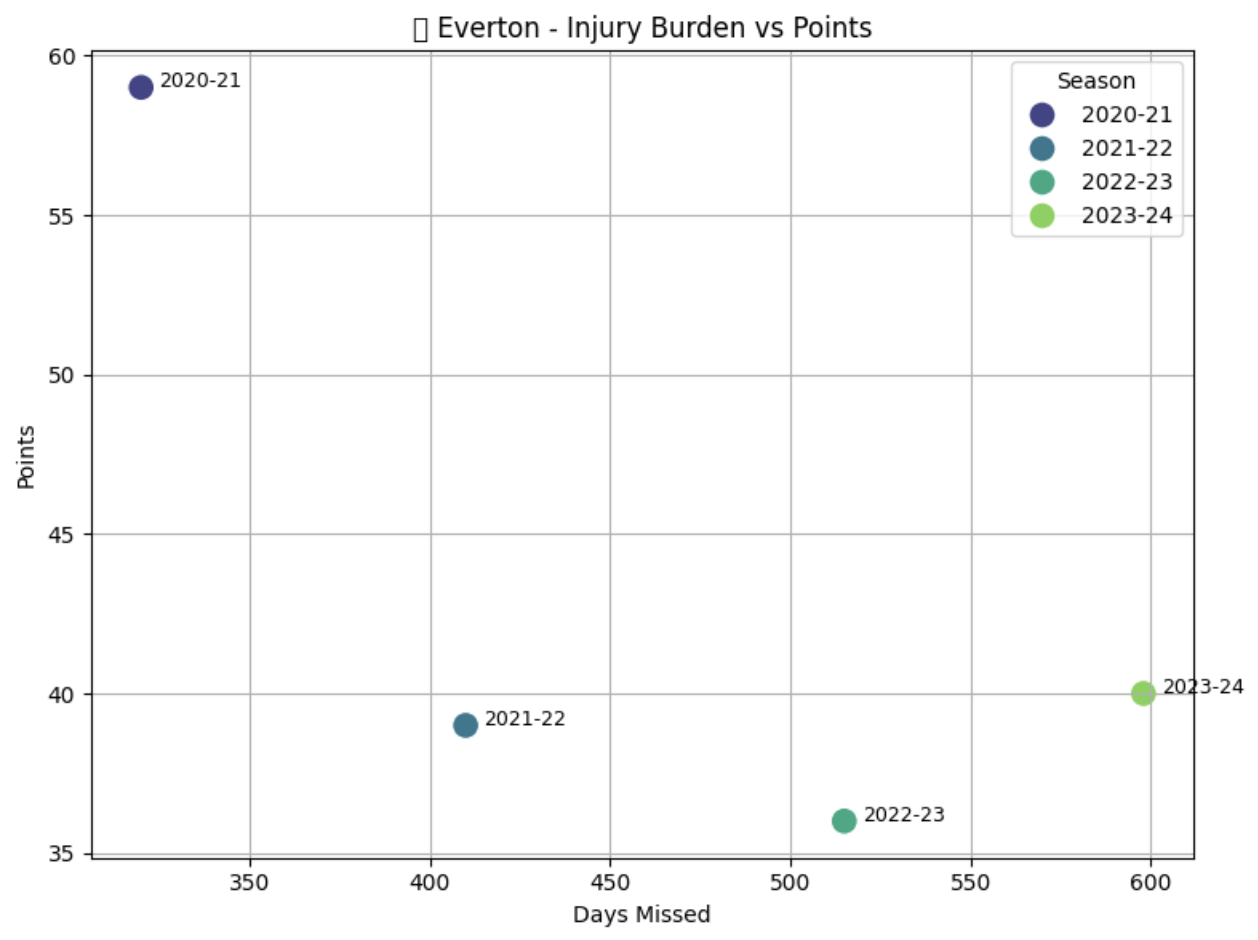
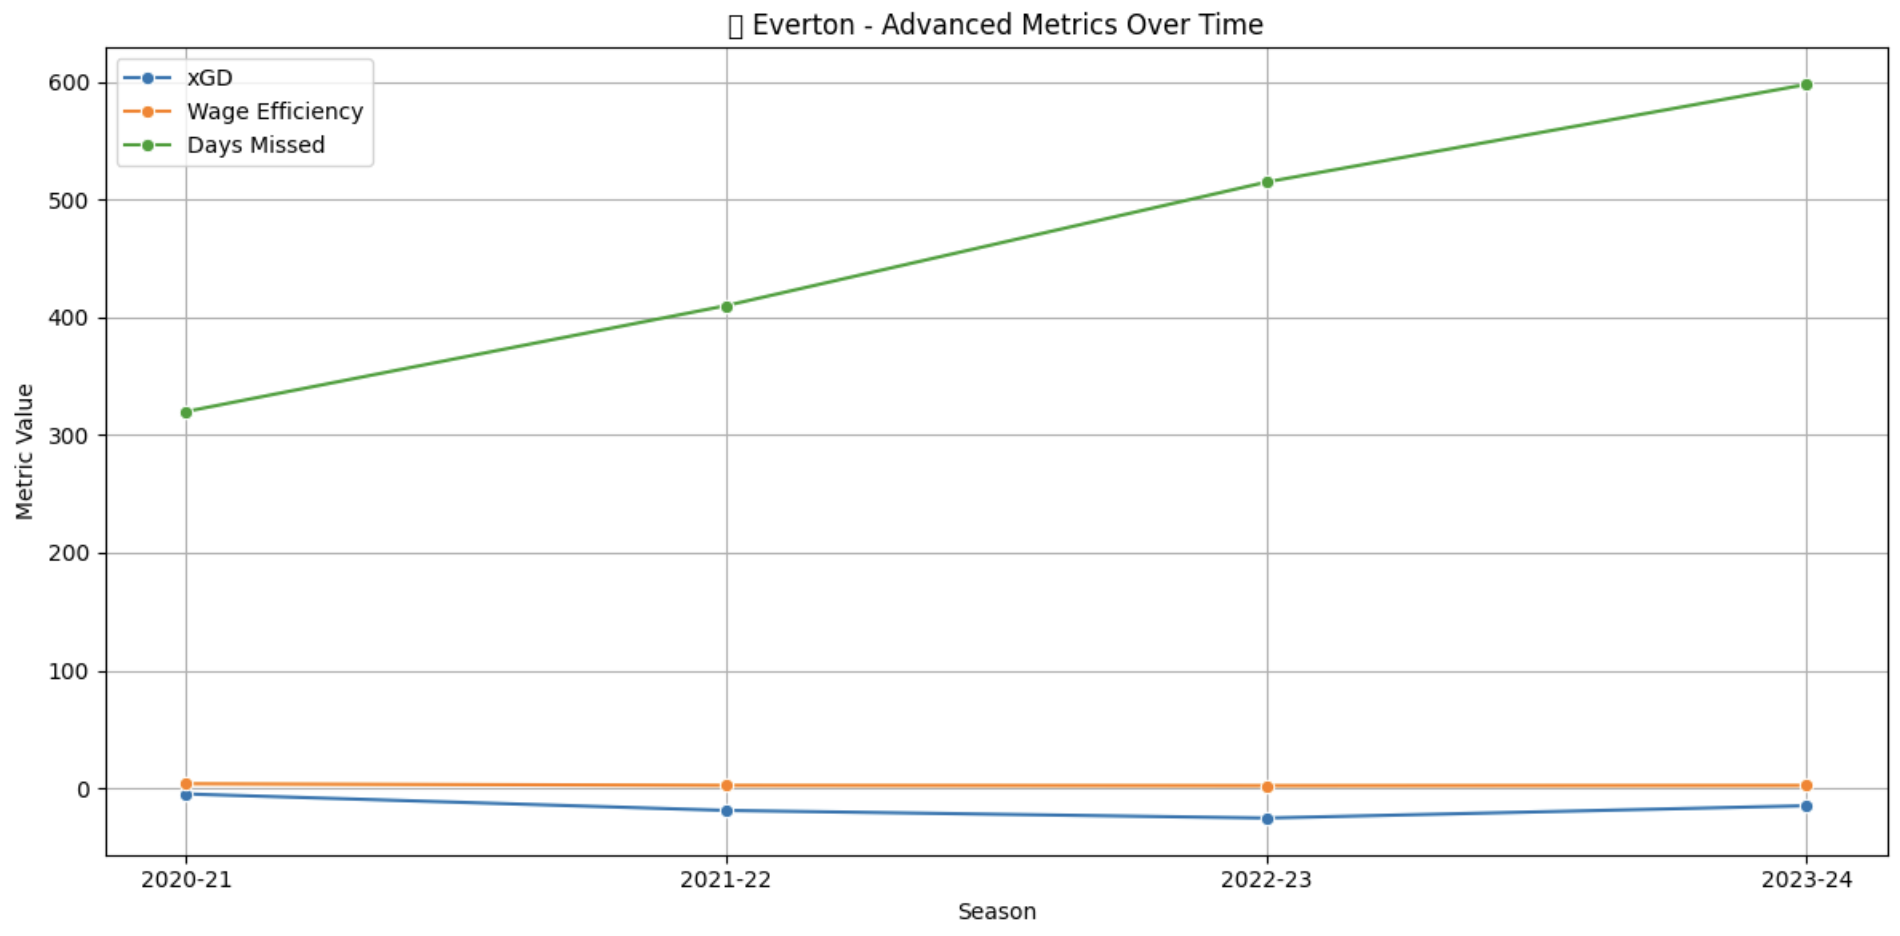
A wage-heavy squad hit by recurrent injuries. Check how it derailed their campaign.
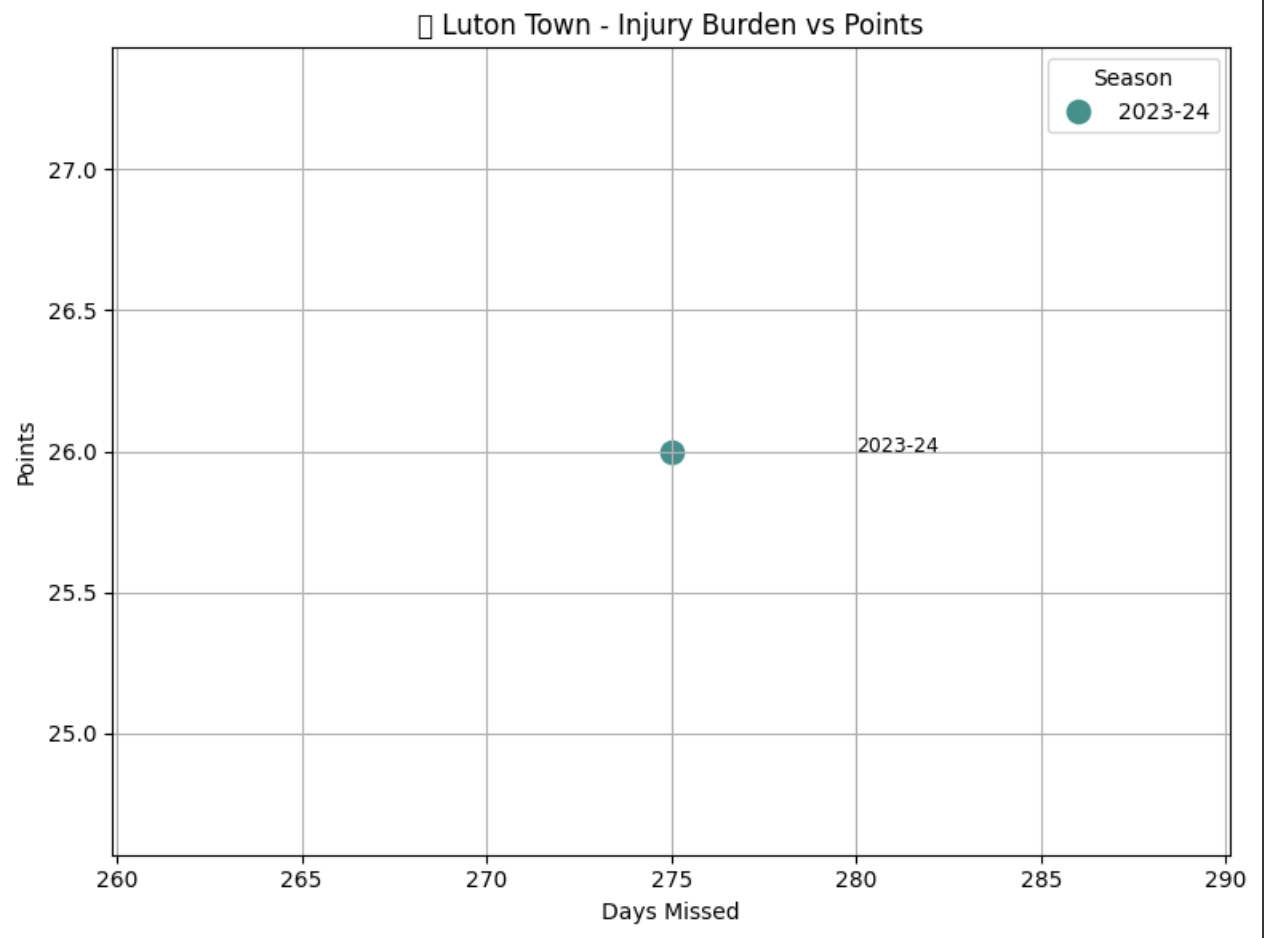
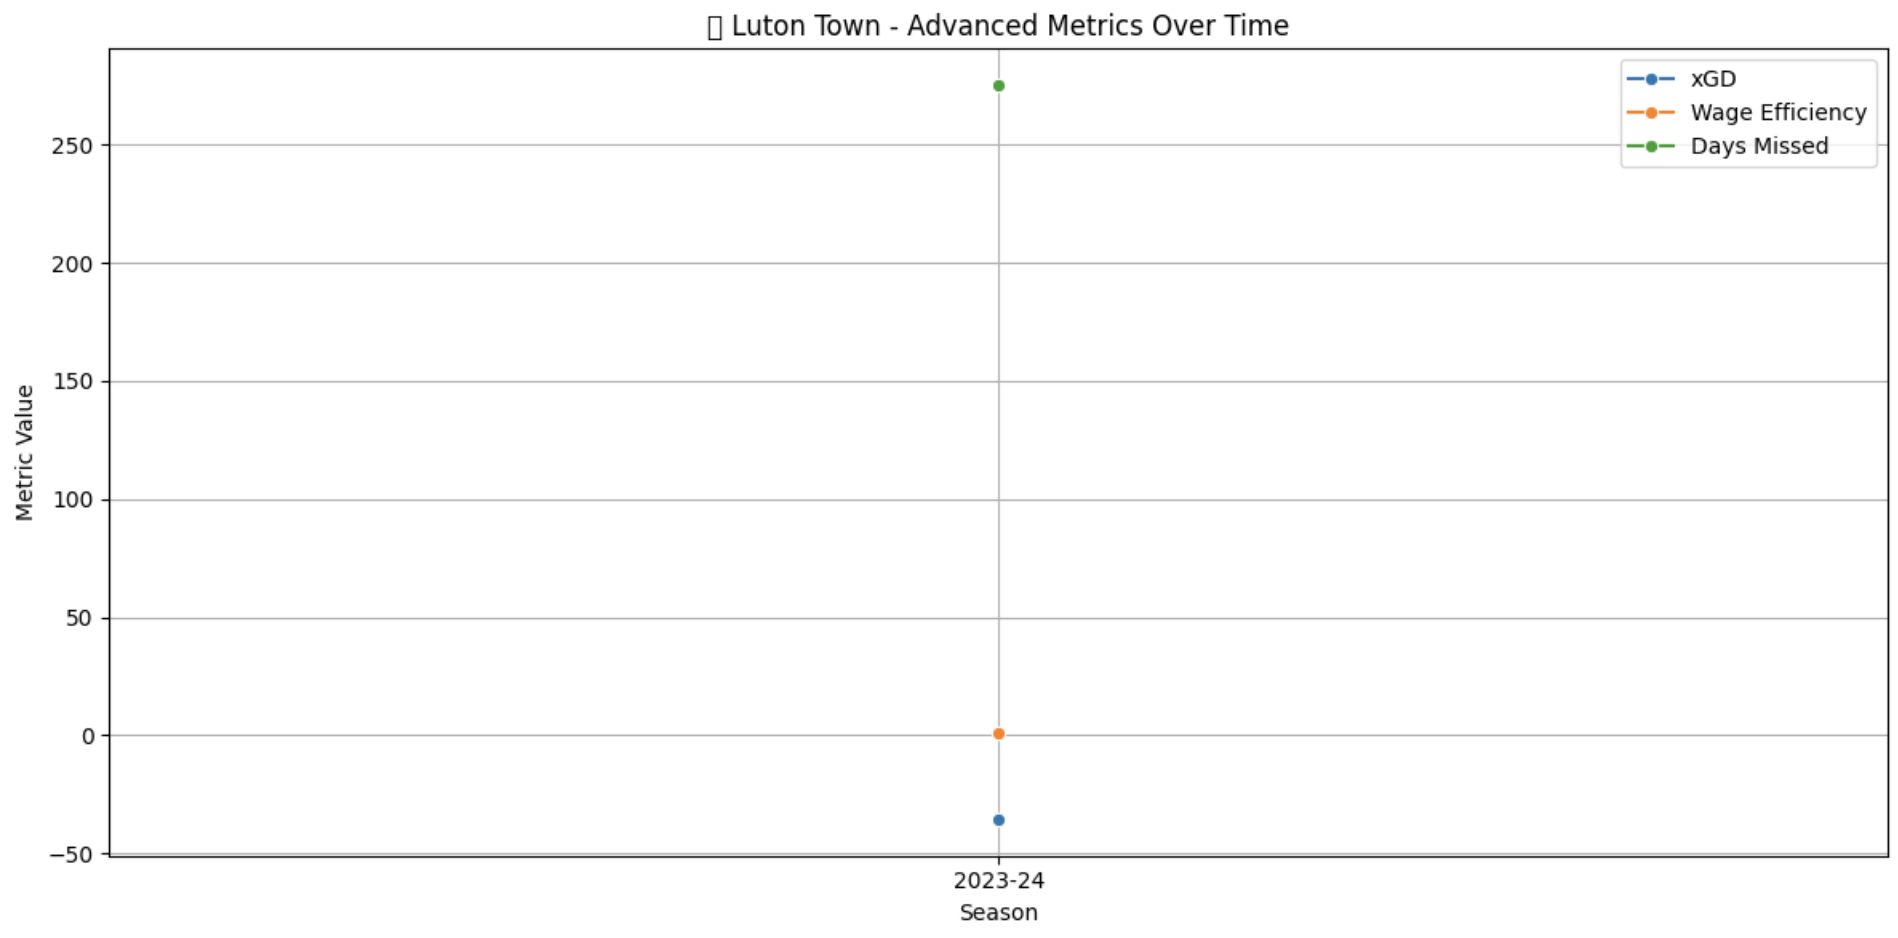
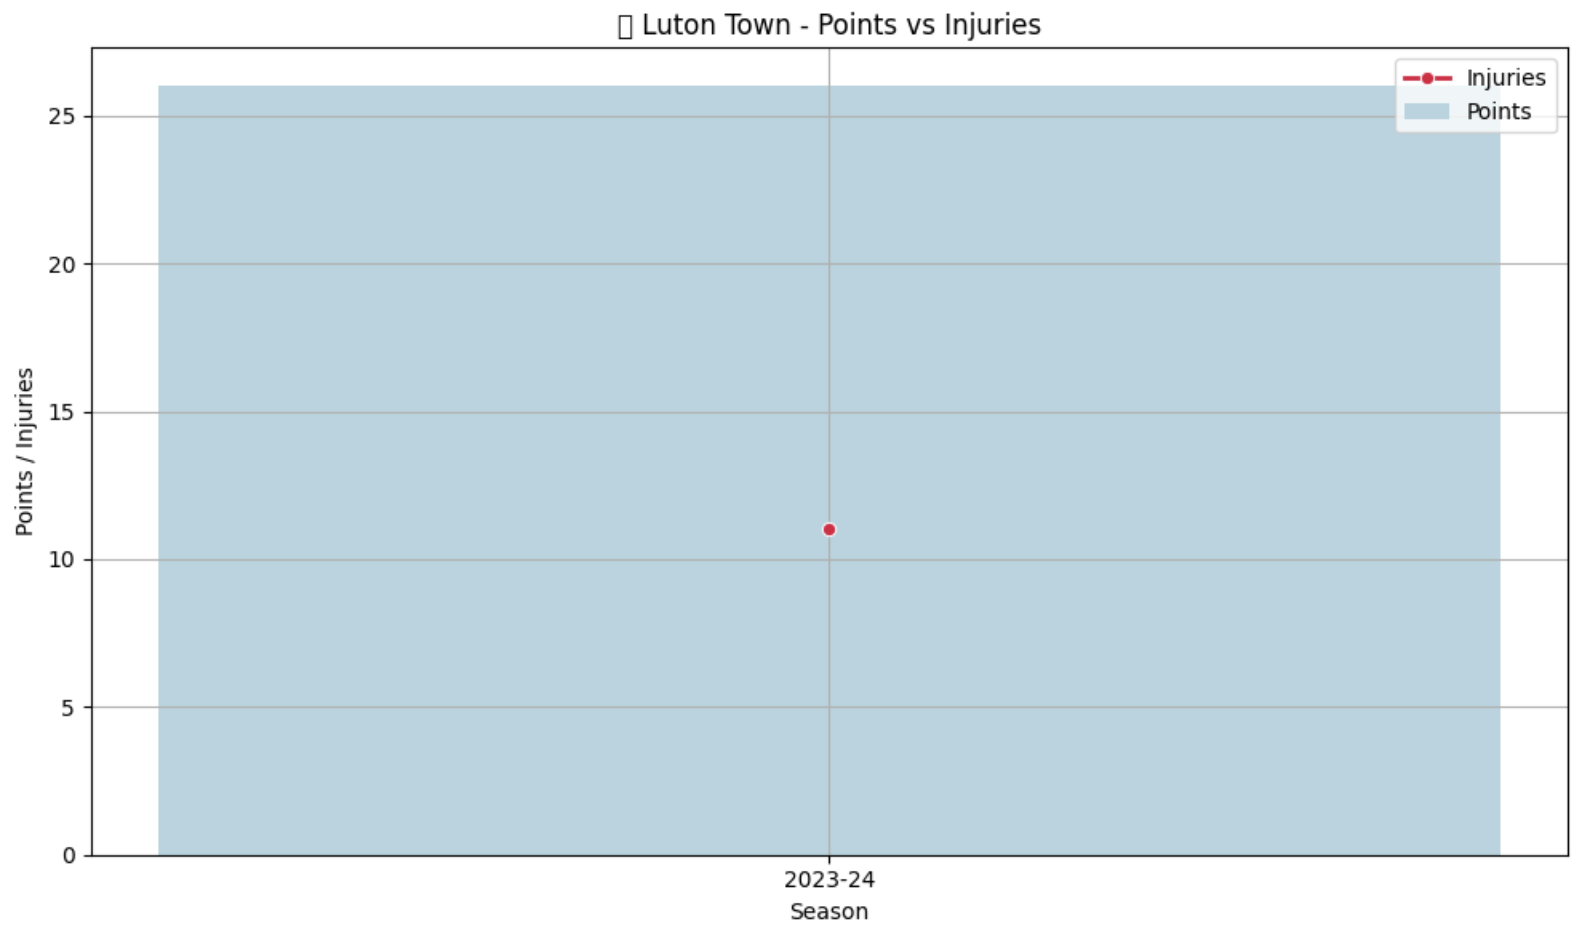
View Insights →

Luton Town

Operating on a shoestring, even minor injuries shook stability. See their survival story.

View Insights →
Most Common Injury Types

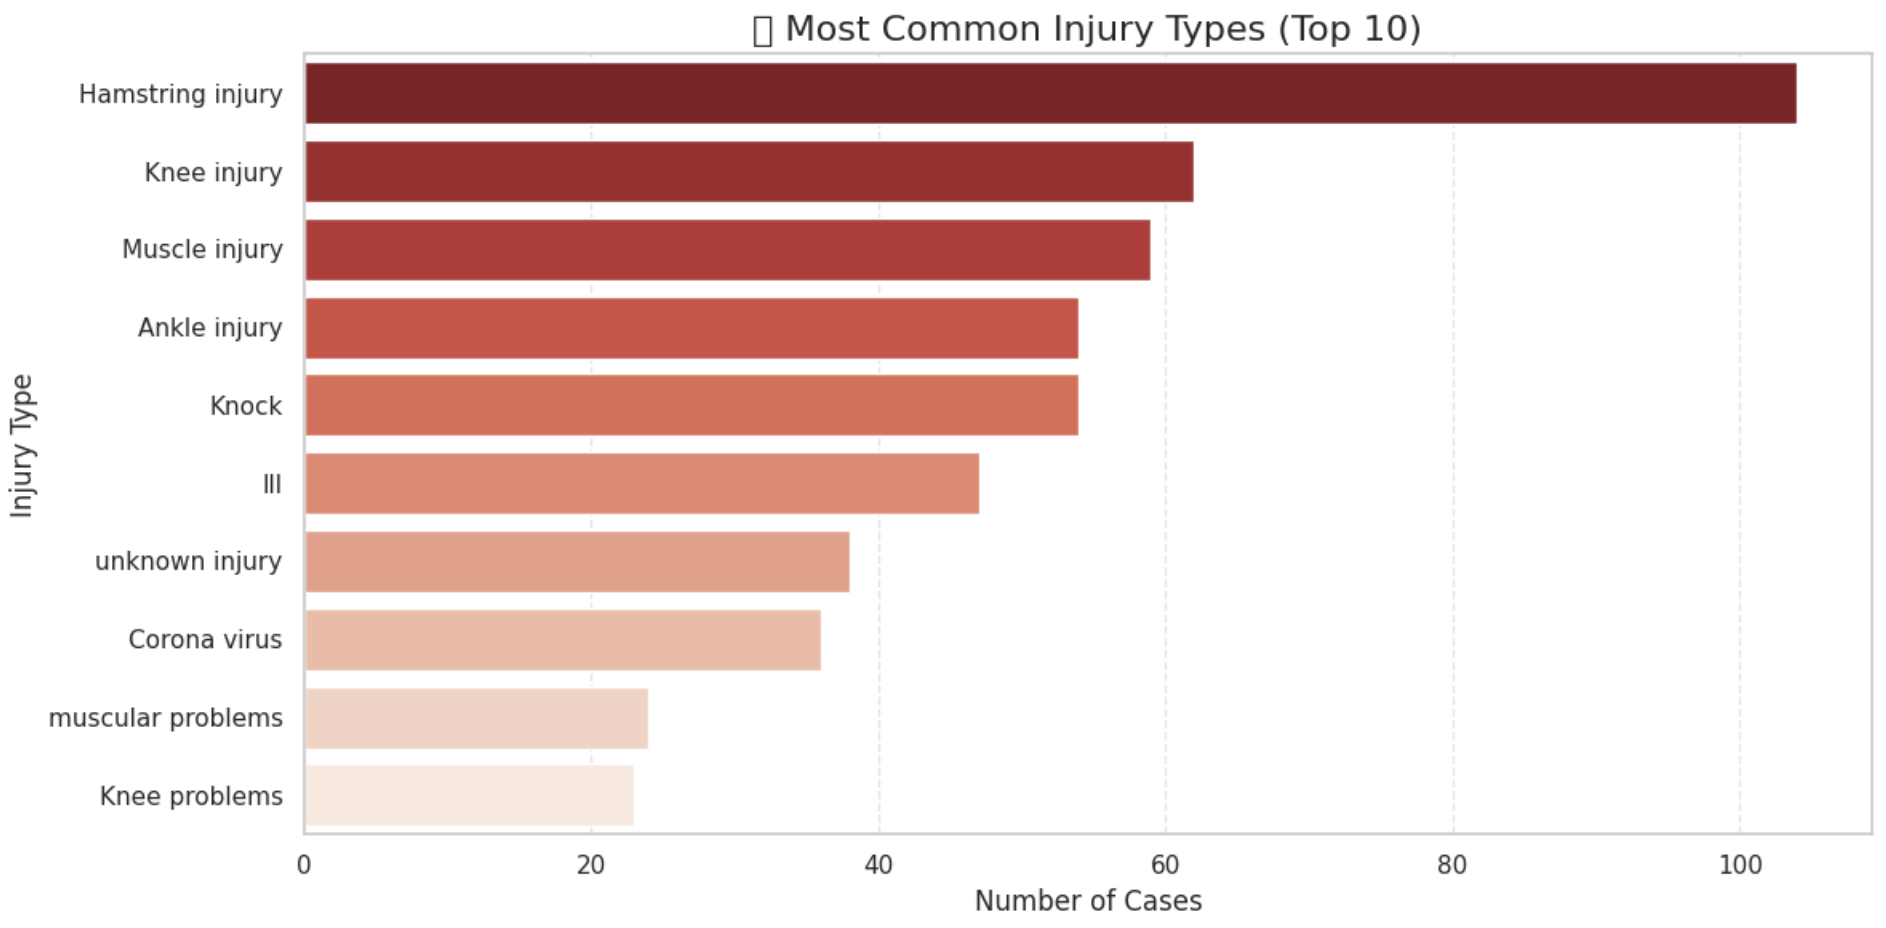
🩹 Most Common Injury Types (Top 10)

Hamstring injuries dominated the EPL injury charts from 2020 to 2024, with over 100 recorded instances, far surpassing knee and muscle injuries. These soft-tissue injuries tend to have longer recovery times and a higher recurrence risk, often affecting high-speed sprinting players like wingers and full-backs.

Other frequent injuries include ankle issues, knocks, and even post-pandemic effects like “illness” and “Corona virus,” highlighting how health crises and intense fixture schedules contributed to diverse injury profiles across squads.

Total Injuries Trend Over Years

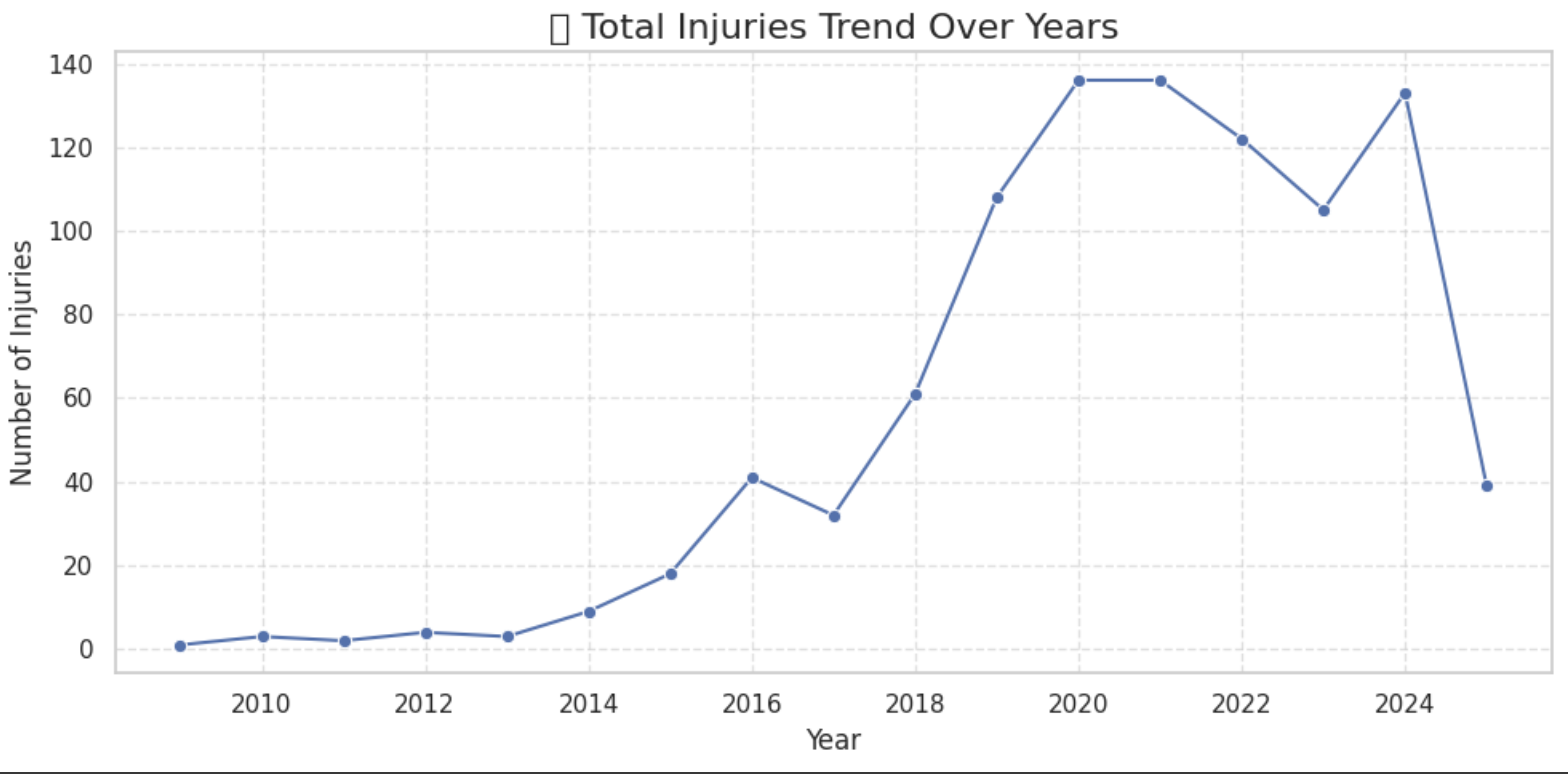
📉 Total Injuries Trend Over Years

The yearly injury trend reveals a sharp uptick starting in 2018, peaking during the 2020–2021 seasons—closely aligned with post-COVID fixture congestion and compressed tournament calendars. Over 130 injuries were recorded in those peak years.

While there was a minor dip in 2022, injuries remained elevated, with 2024 showing another spike. This persistent high volume raises concerns around player workload, rotation policies, and the need for modern injury prevention practices.

Top Players by Avg Recovery Time

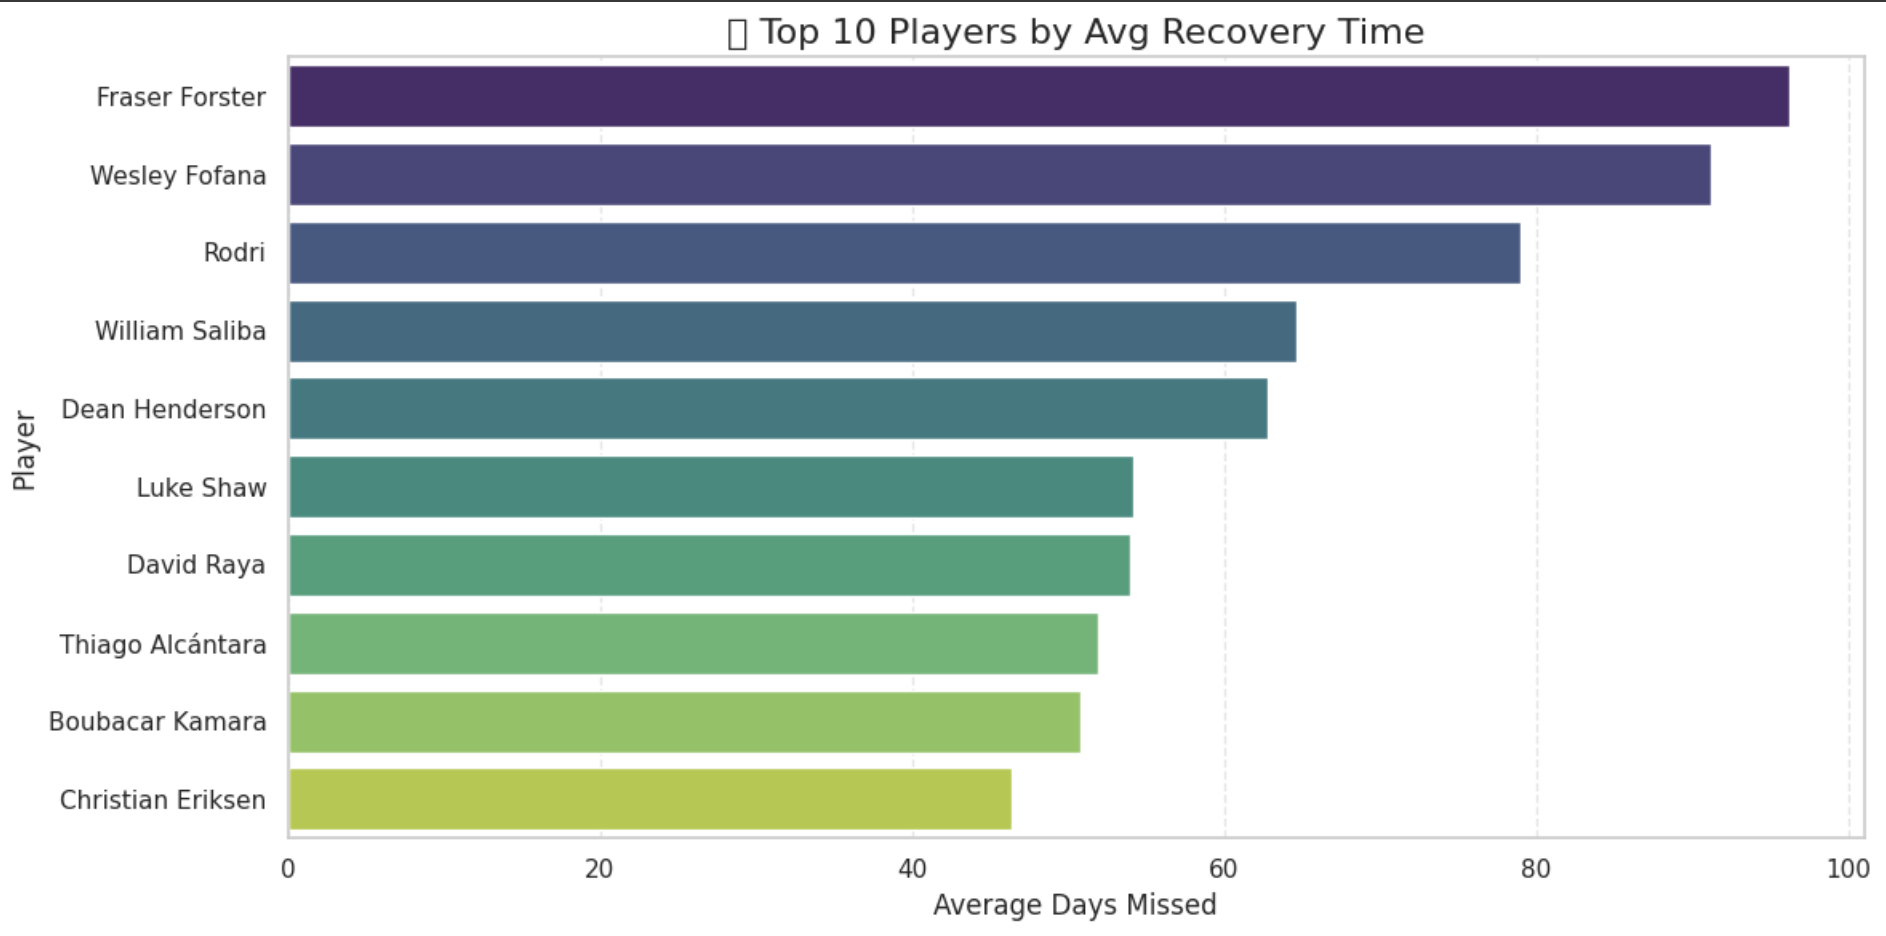
⏳ Top 10 Players by Average Recovery Time

Fraser Forster and Wesley Fofana topped the list of players with the highest average recovery durations, both missing close to 100 days per injury. These extended periods on the sideline not only affect team dynamics but also signal deeper injury management challenges.

Other key players such as Rodri, William Saliba, and Thiago Alcântara also spent significant time out, often due to recurring muscle or ligament issues. The chart highlights the need for individualized recovery planning and medical interventions for high-value assets.

Risk Tier Distribution

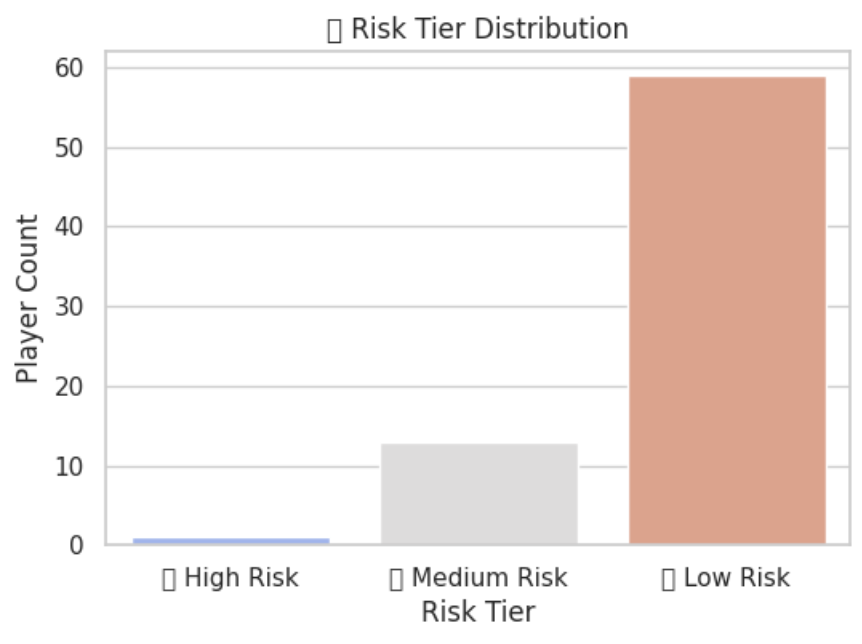
📊 Risk Tier Distribution

Most EPL players fall under the Low Risk injury tier, with only a handful in the High Risk category. This segmentation helps clubs plan rotations, medical support, and player investment decisions.
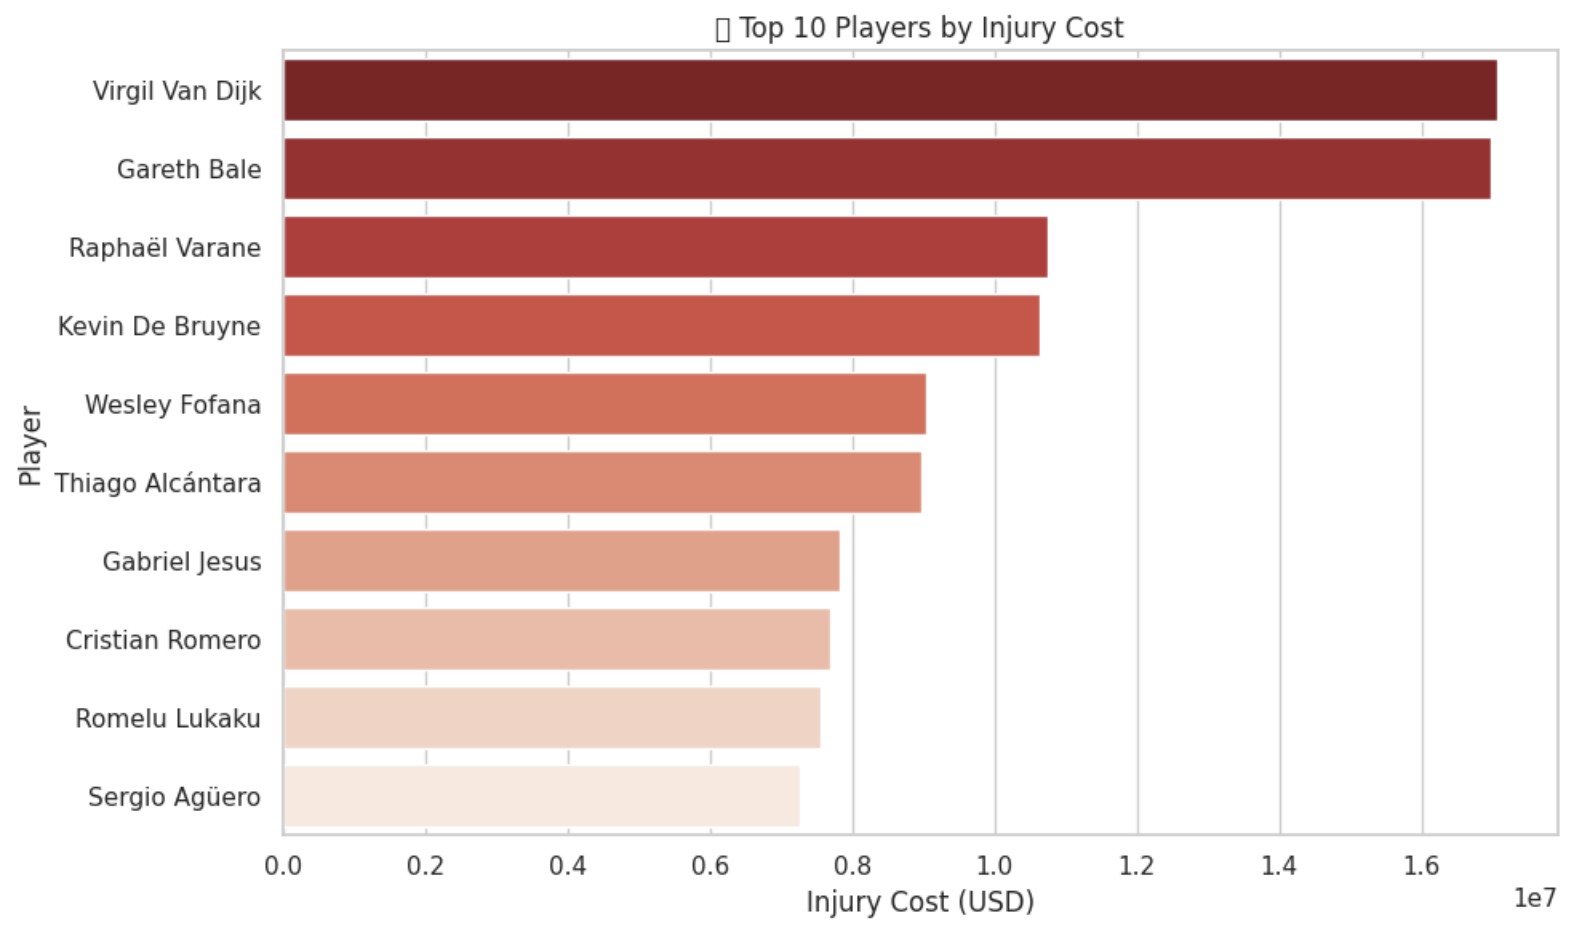
Top 10 Players by Injury Cost

đź’¸ Top 10 Players by Injury Cost

Players like Virgil Van Dijk, Gareth Bale, and Raphaël Varane topped the list of costliest injury cases. These absences not only disrupted tactics but also incurred multi-million dollar financial losses.

% Wage Lost by Risk Tier

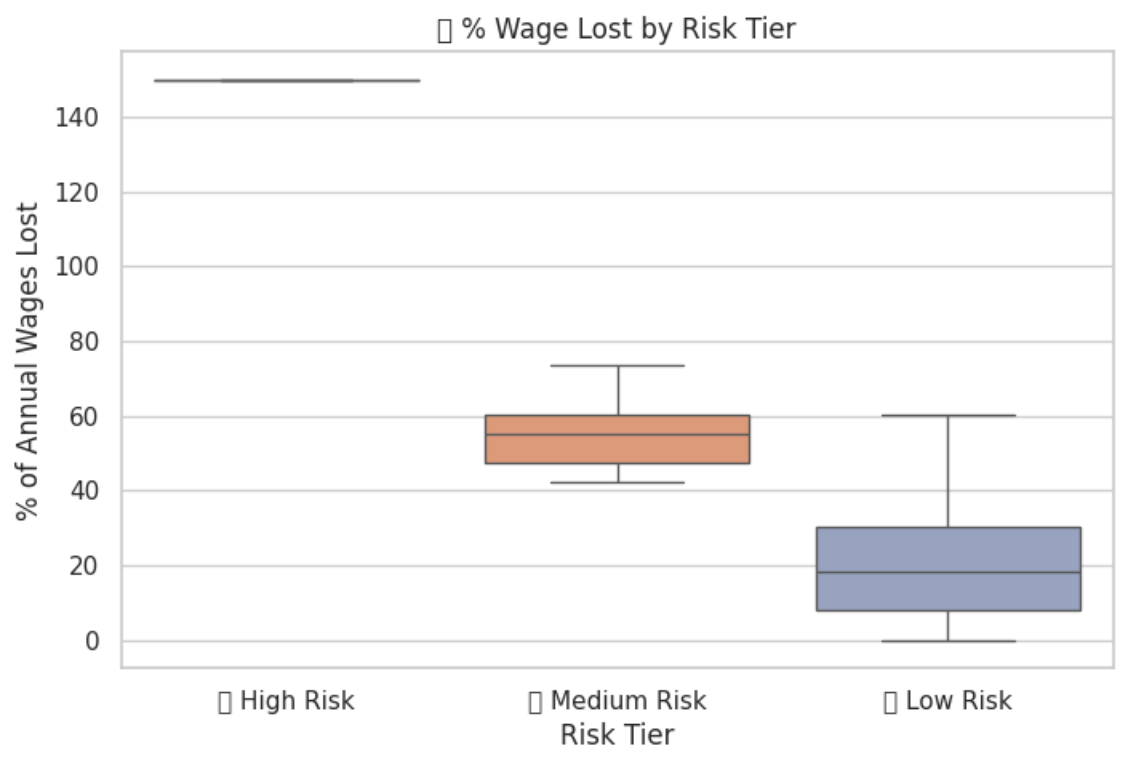
📉 % Wage Lost by Risk Tier

High Risk players had a median wage loss exceeding 100% of annual salary due to repeated injuries, underscoring their volatility. In contrast, Low Risk players showed far better financial reliability.
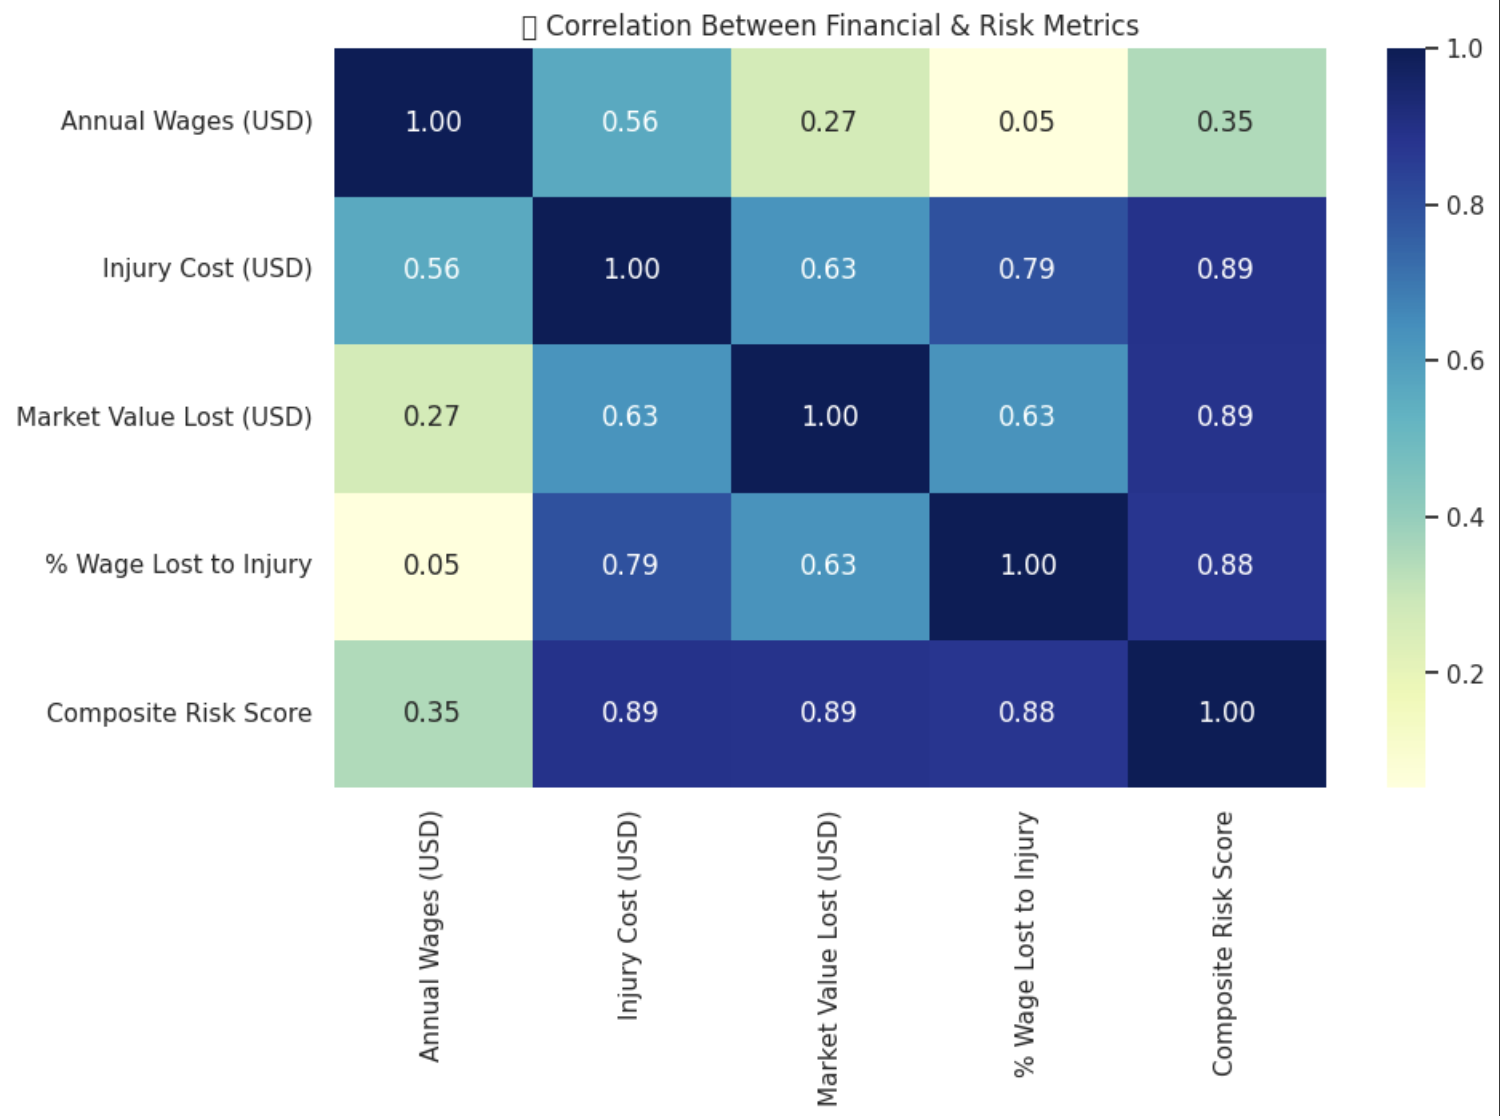
Financial & Risk Correlation Heatmap

đź§  Correlation Between Risk & Financial Metrics

Composite Risk Score showed high correlation with injury cost, market value loss, and wage loss — proving that player fragility is a key driver of financial instability.

Risk Score vs Market Value Lost

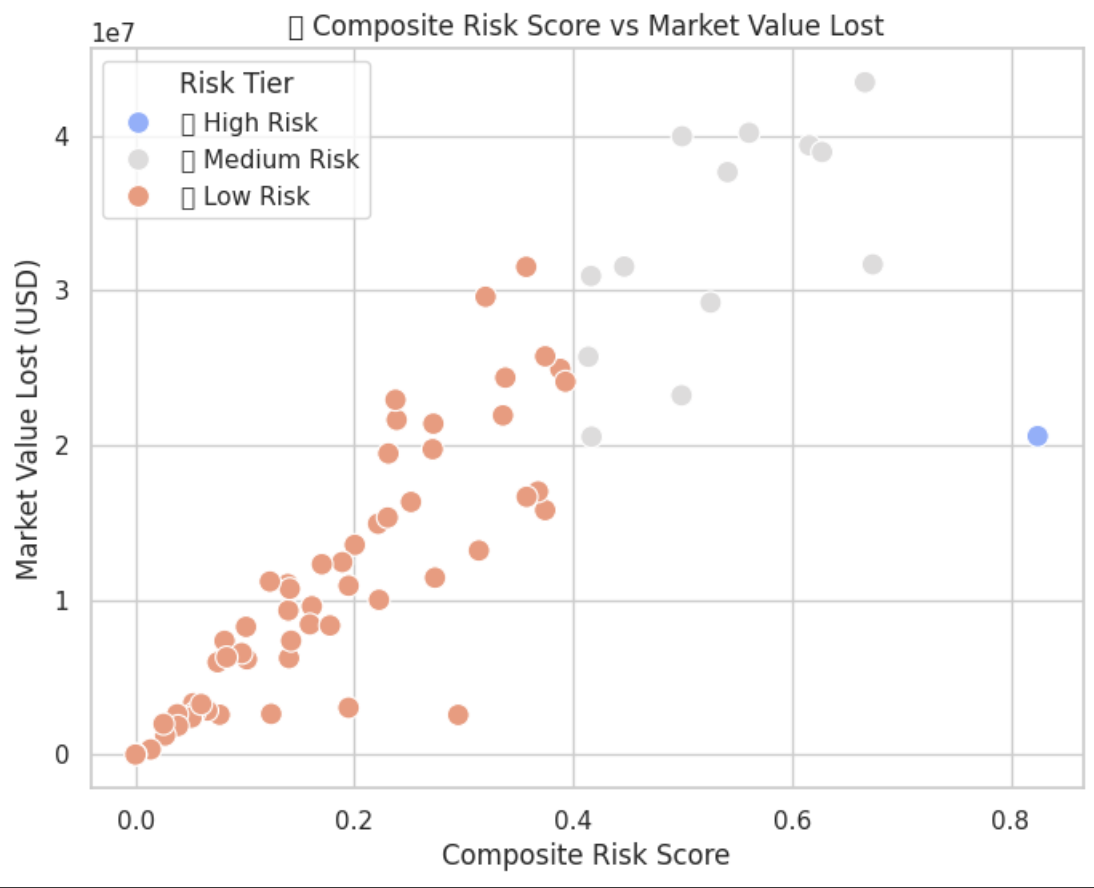
📉 Composite Risk vs Value Lost

A clear trend emerges — higher risk players lead to greater market value depreciation. These insights support smarter contract decisions and better depth planning.

🔵 Manchester City – Injury Impact & Resilience

Despite dealing with injuries throughout the seasons, Manchester City consistently delivered high point totals. The scatterplot shows that even as total days missed varied significantly across seasons, City maintained elite-level performances. In 2021–22, for instance, they missed fewer days but gained the most points — 93, showing how squad depth neutralized risk.

The advanced metric plot highlights City’s impressive xGD (expected goal difference) even during injury-hit seasons like 2023–24. Despite fluctuations in days missed, wage efficiency remained largely stable, indicating exceptional squad planning and wage-to-output alignment — likely influenced by high-quality substitutes and rotation depth.

Interestingly, team injuries had minimal effect on their seasonal point haul. From a high of 32 injuries in 2020–21 to just 6 in 2021–22, the club's performance remained nearly consistent. Their ability to manage minutes and rotate effectively — especially players like Bernardo Silva and Rodri — reflects strategic injury mitigation.

🟠 Brighton – Injuries Managed with Precision

Brighton’s injury burden fluctuated between 180 and 290 days missed per season, yet their points output climbed steadily. Notably, 2022–23 saw the fewest days missed and the highest points, showing how injury reduction directly contributed to competitive performance and tactical continuity.

Brighton’s xGD rose significantly from 2020 to 2023, aided by steady wage efficiency and smart fitness strategies. Although Days Missed ticked up again in 2023–24, the team maintained performance levels. This reflects the influence of dependable players like Pascal Groß and Kaoru Mitoma who provided stability across turbulent injury phases.

Brighton’s minor-to-moderate injury counts each season did not drastically sway point outcomes. Their consistent defensive structure and youth player integration helped absorb injury shocks — a key driver of their surprise top-half finishes across 2022–24.

🟥 Everton – High Wages, High Risk, Low Return

Everton’s injury burden steadily increased each season, peaking above 600 missed days in 2023–24. Despite this, point returns declined or stagnated. Their failure to cope with player absences — especially key players like Dominic Calvert-Lewin and Dele Alli — was a major factor in their underperformance.

Everton’s xGD hovered in the negative range for three consecutive seasons. Wage efficiency plummeted during 2022–23 and remained poor, showcasing a mismatch between spending and return. Poor fitness management amplified their fragility, with limited tactical depth to cover missing players.

Injury counts rose alarmingly from 22 in 2020–21 to over 30 in 2023–24, dragging down both morale and performance. Despite heavy spending, Everton couldn’t translate that into resilience, making them a case study of poor injury ROI and depth vulnerability.

🔴 Luton Town – Fighting Through Fragility

Luton Town had 275 days missed in 2023–24 — a major blow for a club with limited depth. Yet they managed to put up 26 points, a figure that speaks to their cohesion and grit. The data emphasizes how injuries severely restrict low-budget squads.

Their xGD was heavily negative, and wage efficiency hovered around zero. With injuries to core players like Mads Andersen and Tom Lockyer, even modest wage spending couldn’t drive returns. Their advanced metrics underscore the uphill task of survival under strain.

As shown above, Luton’s points remained low while injury counts increased. Their tactical approach—high energy, high press—likely contributed to fatigue-related injuries. Still, the squad showed remarkable tenacity, staying competitive despite significant setbacks.

⬅️ Back to Home 📄 Back to Case Studies